Findings
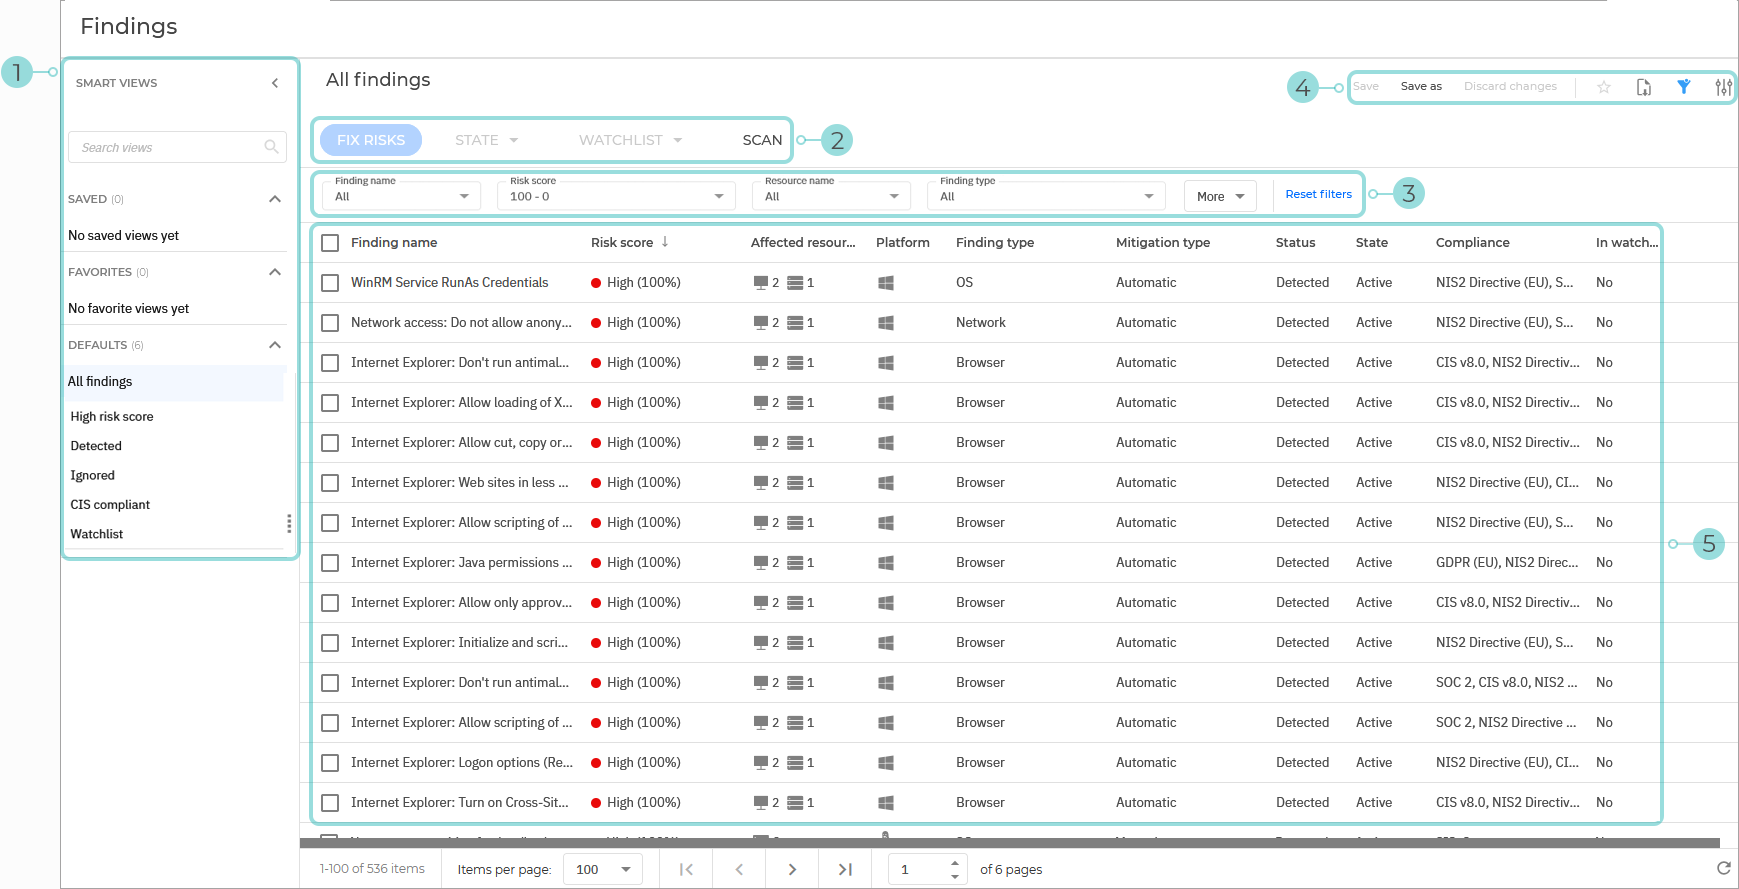
The Findings page displays by default all the GravityZone indicators of risk. It provides detailed info of their severity, number of affected resources, the finding type, mitigation type (manual or automatic), and status (active or ignored).

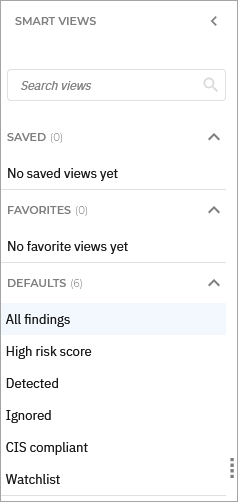
The Smart views panel toggle button. This feature allows you to customize, save, and switch between different loadouts of the Findings page.

The panel has the following sections:
Search views - Use this search field to filter out the views displayed in the sections below, by name.
Saved - This section displays a list of all your saved views that have not been marked as favorites.
Favorites - All views marked as favorites are displayed under this section.
Defaults - This section displays the views that are available by default:
All findings
High severity
Detected
Ignored
CIS complaint
Watchlist
For any view in the Saved or Favorites category, you can click the vertical ellipses
to Rename or Delete the view.
The Finding actions. This section contains the buttons to all the available actions you can take on the risks displayed on the page:
Fix risks - Generate a task to attempt to automatically fix the selected risks.
State - Change the state of the selected risks. The following options are available:
Ignore risks
Restore ignored risks
Watchlist - Add or removed the selected risks from your watchlist. The following options are available:
Add to watchlist
Remove from watchlist
Scan - Perform a scan to check for new risks or updates on known risks.
The Filters section. You can use these options to customize the risks that are displayed in the below grid.
The following filters are currently available:
Filtering option
Details
Finding name
Use the searchable drop-down menu to filter the list of findings by name. Select the finding you want to display and click Apply.
Only the selected findings are displayed.
Risk score
Select a risk score range between 1 and 100.
Only findings with a risk score between these values are displayed.
Resource name
Use the searchable drop-down menu to filter the list of findings based on the name of the resource affected by them. Select the resources you want and click Apply.
Only findings that apply to the selected resources are displayed.
Findings type
Select the type of findings you want to display. Possible values:
Browser
OS
Vulnerability
Network
Cloud
Only findings of the type you select are displayed.
Platform
Use the searchable drop-down menu to filter the list of findings by the platform to which they apply. Select the operating systems you want and click Apply. Possible values:
Unknown
IOS
Android
Windows
Linux
Solaris
Mac OS X
Container
Only findings that affect the selected platforms are displayed.
Mitigation type
Use the searchable drop-down menu to filter the list of findings by mitigation type. Select the mitigation types you want and click Apply. Possible values:
Manual
Automatic
Only findings where the types of mitigation you selected applies are displayed.
Status
Use the searchable drop-down menu to filter the list of findings by status. Select the statuses you want and click Apply. Possible values:
Compliant
Detected
Only findings with the statuses you selected are displayed.
State
This filter allows you to sort the list of findings by their state, Active or Ignored.
Use the searchable drop-down menu to filter the list of findings by state. Select the states you want and click Apply. Possible values:
Active
Ignored
Only findings with the states you selected are displayed.
Compliance
Select the compliance standard you want to display the findings for.
Only findings resulted from checks based on rules belonging to the Compliance Standards you selected are displayed.
Affected resource
Use the drop-down menu to filter the list of findings by the resources that are affected by the findings. Select the resources you want and click Apply.
The following values are available:
Endpoint
Server
Not affected
Only findings affecting the selected resource types are displayed.
In watchlist
Use this filter to display findings based on them currently being included in a watchlist. Possible values:
Yes
No
Regions
Use this filter to display findings based on the region where the affected resources are located.
The View options menu. This section provides you with multiple functions for working with views:
Save - Save changes you make to a saved view.
Save as - Save a modified view under a different name.
Discard changes - Revert the saved view to its original state.
Add to favorites - Add the view to the Favorites category.
Export view - Download the information in a
.csvfile, which can contain up to 1500 rows.Show or hide filters - Hide or display the filters menu.
Open settings - Display the Settings panel.
You can use this panel to customize what columns are displayed in the view and enable or disable the Compact view.
The Findings grid. The grid displays all known findings in your company, based on your last scan.
The information available for each findings is displayed under the following columns:
Finding name - The name of the finding.
Risk score - The risk score of the finding. Hovering over the score displays a breakdown of how it was calculated.
Affected resources - The number of resources affected by this finding, displayed per type.
Platform - The type of operating system that is affected by the finding.
Finding type - The type of the finding.
Mitigation type - The type of mitigation that can be applied to this finding.
Status - The status of the finding.
State - The state of the finding.
Compliance - The compliance standards corresponding to the check that resulted in the creation of the finding.
In watchlist - Indicates if the finding is currently in the watchlist.
Note
More details regarding the information in each column are available type in the Filters section.
Actions button - Displays all the actions you can take on each finding. Possible values:
Fix risk
Ignore risk
Add to watchlist