Using actions
Using actions
When taking actions on entities in Network, new tasks are created.
Note
To run a task on more than 1,000 entities, group the entities into a folder and assign the task to the folder. There is no limit to how many entities a folder can contain, and the task will apply to all entities within it.
This is the list of tasks you can run:
You can choose to create tasks individually for each computer or for groups of computers. For example, you can remotely install the security agent on a group of unmanaged computers. At a later time, you can create a scan task for a certain computer from the same group.
For each computer, you can only run compatible tasks. For example, if you select an unmanaged computer, you can only choose to install the security agent, all the other tasks being disabled.
For a group, the selected task will be created only for compatible computers. If none of the computers in the group is compatible with the selected task, you will be notified that the task could not be created.
When you, as a Partner, assign a task to endpoints in multiple managed companies, GravityZone creates one task for each company. A task contains only sub-tasks for endpoints in that company.
Note
To assign a task to endpoints in Customer companies managed by a Partner company, you can only select those companies but not the Partner company itself. To assign a task to endpoints in the Partner company, you must first access the Network inventory of that company. You cannot assign a task to endpoints in multiple Partner companies at once; instead, you must access the Network inventory of each company one by one.
Once created, the task will start running immediately on the online computers. If a computer is offline, the task will run as soon as it gets back online.
You can view and manage the task in the Network > Tasks page. For more information, refer to Viewing and managing tasks.
Malware scan
Log in to GravityZone Control Center.
Go to the Network page from the left side menu.
Select the checkboxes of the entities you want to scan.
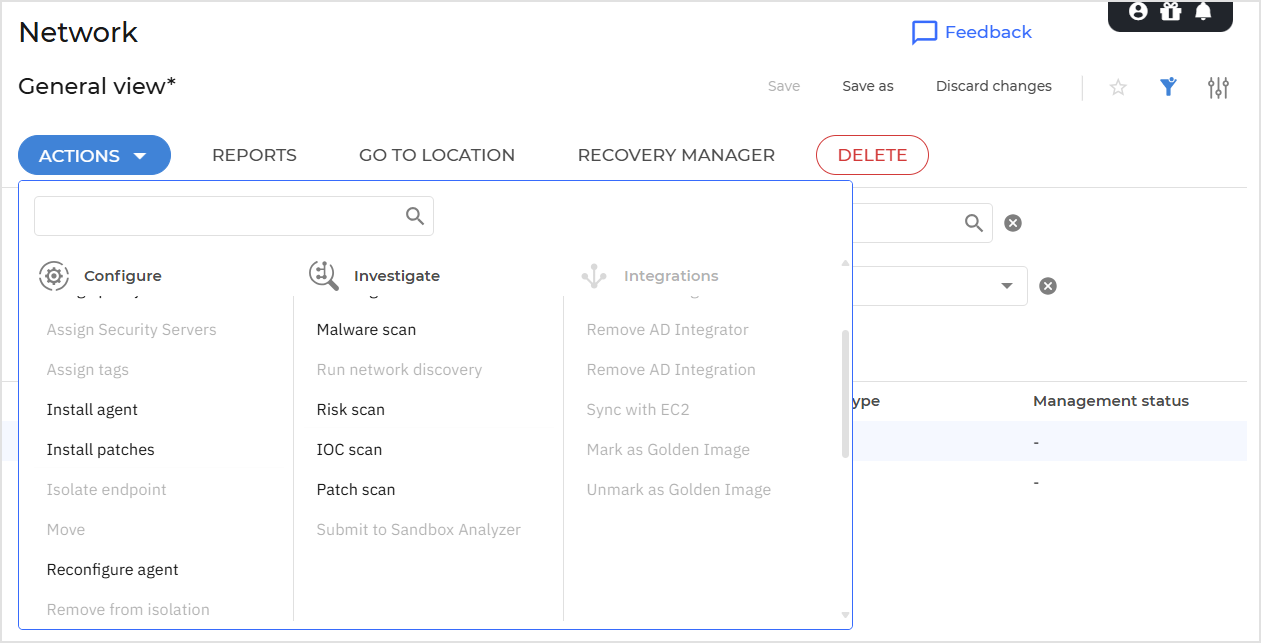
Click the Actions button at the upper side of the table and select Malware scan.
A configuration window will appear.
Configure the scan options:
In the General tab, you can choose the type of scan and you can enter a name for the scan task.
The scan task name is intended to help you easily identify the current scan in the Tasks page.
Select the type of scan from the Type menu:
Quick scan uses in-the-cloud scanning to detect malware running in the system. This type of scan is preconfigured to allow scanning only critical Windows and Linux system locations. Running a Quick Scan usually takes less than a minute and uses a fraction of the system resources needed by a regular virus scan.
When malware or rootkits are found, Bitdefender automatically proceeds with disinfection. If, for any reason, the file cannot be disinfected, then it is moved to quarantine. This type of scanning ignores suspicious files.
Full scan checks the entire system for all types of malware threatening its security, such as viruses, spyware, adware, rootkits and others.
Bitdefender automatically tries to disinfect files detected with malware. In case malware cannot be removed, it is contained in quarantine, where it cannot do any harm. Suspicious files are being ignored. If you want to take action on suspicious files as well, or if you want other default actions for infected files, then choose to run a Custom Scan.
Memory scan checks the programs running in the endpoint's memory.
Network scan is a type of custom scan, allowing to scan network drives using the Bitdefender security agent installed on the target endpoint.
For the network scan task to work:
You need to assign the task to one single endpoint in your network.
You need to enter the credentials of a user account with read/write permissions on the target network drives, for the security agent to be able to access and take actions on these network drives. The required credentials can be configured in the tTarget section of the task window.
Note
For memory, network and custom scans, you have also these options:
Run the task with low priority. Select this checkbox to decrease the priority of the scan process and allow other programs to run faster. This will increase the time needed for the scan process to finish.
On ARM-based macOS endpoints, the security agent optimizes the scan process depending on the processor usage. At over 50% usage, the scan process relocates to the efficiency cores, while at over 80% the task pauses until the processor usage drops below this threshold. Intel-based macOS endpoints do not support the Run the task with low priority option.
Shut down computer when scan is finished. Select this checkbox to turn off your machine if you do not intend to use it for a while.
Pause scan when computer is in Battery mode: this option helps you pause the scanning process on endpoints running on battery power and automatically resume it once they are plugged back in.
Enable CPU usage control: this option allows you to adjust the CPU usage allocated for the scanning process and tailor the scan performance to your needs. The option is available for all operating systems, offering three levels:
Low
macOS: One core is reserved for scanning from the total number of available cores. The scanning process pauses when the idle CPU usage falls below 75% of the remaining cores and automatically resumes when idle CPU usage rises above this threshold.
Windows and Linux: the scanning process uses up to 25% of the total CPU.
Medium
macOS: One core is reserved for scanning from the total number of available cores. The scanning process pauses when the idle CPU usage falls below 50% of the remaining cores and automatically resumes when it rises above this threshold.
Windows and Linux: the scan uses up to 50% of the total CPU.
High
macOS: One core is reserved for scanning from the total number of available cores. The scanning process pauses when the idle CPU usage falls below 25% of the remaining cores and automatically resumes when it rises above this threshold.
Windows and Linux: no CPU usage limit is imposed on the scanning process.
Note
Selecting a specific CPU usage profile directly impacts the duration of the scan task. Lower CPU usage results in longer scan times, while higher CPU usage speeds up the scanning process.
Custom scan allows you to choose the locations to be scanned and to configure the scan options.
For custom scans, configure the following settings:
Go to the Options tab to set the scan options.
Click the security level that best suits your needs (Aggressive, Normal or Permissive).
Use the description on the right-side of the scale to guide your choice.
Based on the selected profile, the scan options in the Settings section are automatically configured. However, if you want to, you can configure them in detail. To do that, select the Custom checkbox and then expand the Settings section.
The following options are available:
File types
Use these options to specify which types of files you want to be scanned.
You can set the security agent to scan all files (regardless of their file extension), application files only or specific file extensions you consider to be dangerous.
Scanning all files provides best protection, while scanning applications only can be used to perform a quicker scan.
Note
Application files are far more vulnerable to malware attacks than other types of files.
For more information, refer to Application file types.
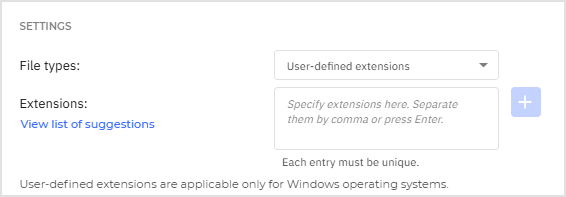
If you want only specific extensions to be scanned, choose Custom extensions from the menu and then enter the extensions in the edit field, pressing
Enterafter each extension.Important
Bitdefender security agents installed on Windows and Linux operating systems scan most of the .ISO formats, but does not take any action on them.
Archives
Archives containing infected files are not an immediate threat to system security.
The malware can affect the system only if the infected file is extracted from the archive and executed without having real-time protection enabled.
However, it is recommended to scan archives in order to detect and remove any potential threat, even if it is not an immediate threat.
Important
Scanning archived files increases the overall scanning time and requires more system resources.
Scan inside archives
Select this option if you want to check archived files for malware.
If you decide on using this option, you can configure the following optimization options:
Limit archive size to (MB)
You can set a maximum accepted size limit of archives to be scanned.
Select the corresponding checkbox and type the maximum archive size (in MB).
Maximum archive depth (levels)
Select the corresponding checkbox and choose the maximum archive depth from the menu.
For best performance choose the lowest value, for maximum protection choose the highest value.
Scan email archives
Select this option if you want to enable scanning of email message files and email databases, including file formats such as .eml, .msg, .pst, .dbx, .mbx, .tbb and others.
Important
Email archive scanning is resource intensive and can impact system performance.
Miscellaneous
Select the corresponding checkboxes to enable the desired scan options.
Scan boot sectors
Scans the system’s boot sector.
This sector of the hard disk contains the necessary computer code to start the boot process.
When a virus infects the boot sector, the drive may become inaccessible and you may not be able to start your system and access your data.
Scan UEFI
This option enables Unified Extensible Firmware Interface (UEFI) scanning ensuring the security and integrity of the system's boot process and protecting against sophisticated threats that can persist at the firmware level.
The option is available for Full, Quick, and Custom scan types and is enabled by default when the security level is set to Aggressive.
Scan registry
Select this option to scan registry keys.
Windows Registry is a database that stores configuration settings and options for the Windows operating system components, as well as for installed applications.
Scan for rootkits
Select this option to scan for glossary.rootkit rootkits and objects hidden using such software.
Scan for keyloggers
Select this option to scan for glossary.keylogger keylogger software.
Scan network shares
This option scans mounted network drives.
For quick scans, this option is deactivated by default. For full scans, it is activated by default. For custom scans, if you set the security level to Aggressive/Normal, the Scan network shares option is automatically enabled. If you set the security level to Permissive, the Scan network shares option is automatically disabled.
Scan memory
Select this option to scan programs running in the system's memory.
Scan cookies
Select this option to scan the cookies stored by browsers on the computer.
Scan only new and changed files
By scanning only new and changed files, you may greatly improve overall system responsiveness with a minimum trade-off in security.
Scan for potentially unwanted applications (PUA)
A potentially unwanted application (PUA) is a program that may be unwanted on the PC and sometimes comes bundled with freeware software. Such programs can be installed without the user's consent (also called adware) or will be included by default in the express installation kit (ad-supported). Potential effects of these programs include the display of pop-ups, installing unwanted toolbars in the default browser or running several processes in the background and slowing down the PC performance.
Preserve last access time
This option helps you control whether to preserve the last access time for a file during a scan or to allow the scanning process to modify the timestamp of that file. The option is enabled by default.
Scan detachable volumes
Select this option to scan any removable storage drive attached to the endpoint.
Actions
Depending on the type of detected file, the following actions are taken automatically:
When an infected object is found
Bitdefender detects objects (such as files and registries) as infected through various advanced mechanisms, which include malware signatures, machine learning, and artificial intelligence (AI) based technologies.
The security agent typically handles infected objects by denying access to them and moving them to quarantine. An attempt is then made to disinfect the system by removing the malware code and any artifacts created by the malware.
If an infected object is detected, the security agent will automatically attempt to remediate it.
Important
For particular types of malware, disinfection is not possible because the detected object is entirely malicious. In such cases, the infected object is deleted from the disk.
When a rootkit is found
Rootkits represent specialized software used to hide files from the operating system.
Though not malicious in nature, rootkits are often used to hide malware or to conceal the presence of an intruder into the system.
Detected rootkits and hidden files are ignored by default.
When a potentially unwanted application (PUA) is found
By default, detected potentially unwanted applications are only reported, but not remediated.
Though not recommended, you can change the default actions.
The following actions are available:
Remediate
Access to the infected objects is denied, and they are moved to quarantine. An attempt is then made to disinfect the system by removing the malware code and any artifacts created by the malware.
It is recommended to always keep this as the default action to be taken on infected objects.
Note
To automatically move the infected objects to quarantine, make sure you have selected Copy files to quarantine before applying the disinfect action in the Antimalware > Settings section of the policy.
Move to quarantine
Infected objects are moved from their current location to the quarantine folder.
Quarantined files cannot be executed or opened; therefore, the risk of getting infected disappears.
You can manage quarantine files from the Quarantine page of the console.
Report only
No action will be taken on infected objects. These objects will only appear in the scan log.
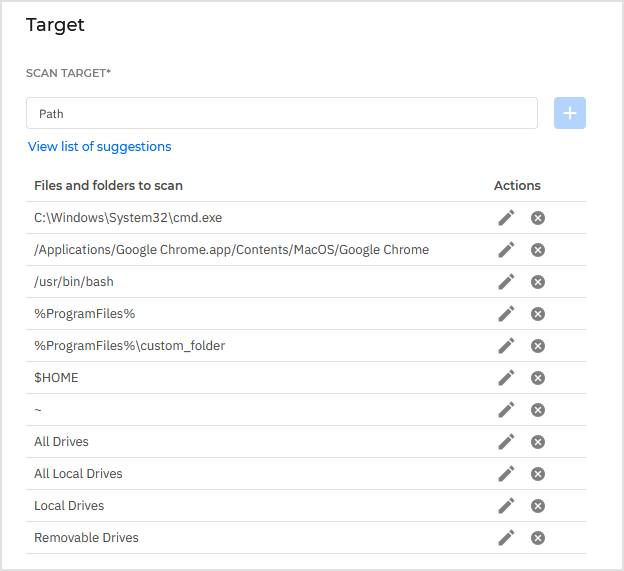
Go to the Target section to configure the locations to scan on target endpoints. Locations include files, folders, local drives, removable drives, and network shares.
Under Scan target, define the path to scan using one of the following methods:
Full path. Enter the absolute path to the file or folder.
Windows:
C:\Windows\System32\cmd.exe- scans thecmd.exefile.
macOS:
/Applications/Google Chrome.app/Contents/MacOS/Google Chrome- scans theGoogle Chromefolder.
Linux:
/usr/bin/bash- scans thebashfile.
System variables. As best practice, use system variables (where appropriate) to make sure the path is valid on all target computers.
Windows:
%ProgramFiles%- scans the entireProgram Filesfolder.%ProgramFiles%\<folder_name>- scans a subfolder.
macOS:
$HOMEor~- scans the user profile folder.
For more information, refer to System variables.
Predefined locations. When you enter a predefined location, it applies to all endpoints regardless of the operating system.
GravityZone supports predefined locations as described below.
Location
Windows
Linux
macOS
All DrivesAll Local DrivesLocal DrivesScans all local drives.
Scans the entire system (equivalent to
/).Scans all local drives.
Removable DrivesScans all removable drives.
Not supported.
Scans all removable drives.
Click the
 Add button.
To edit an existing location:
Click the
 Edit button in the Actions column.
Modify the location.
Click the
 OK button to confirm the changes.
Alternately, click the
 Cancel button to discard the changes.
To remove a location, click the
Delete button in the table.For network scan tasks, you need to enter the credentials of a user account with read/write permissions on the target network drives, for the security agent to be able to access and take actions on these network drives.
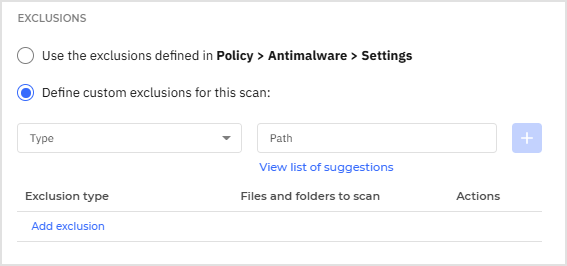
Click the Exclusions section if you want to define target exclusions.
To use the exclusions defined in the current policy, select Use the exclusions defined in Policy > Antimalware > Settings.
To define exclusions for the current scan task, select Define custom exclusions for this scan, then add the required paths. You can use full paths, system variables, and predefined locations.
For more details regarding exclusions, refer to Exclusions.
Click Save to create the scan task. A confirmation message will appear.
You can view and manage the task on the Network > Tasks page. For more information, refer to Viewing and managing tasks.
Note
To schedule a scan task, go to the Policies page from the left side menu, select the policy assigned to the computers you are interested in, and add a scan task in the Antimalware > On-demand section. For more information, refer to On-demand.
IOC scan
At any time, you can choose to run on-demand scanning for known Indicators of Compromise (IOC) on selected endpoints.
Important
This task is only available for plans that include the EDR / XDR feature.
Running an IOC scan task
To run an IOC scan task, follow these steps:
Log in to GravityZone Control Center.
Go to the Network page from the left side menu.
Browse the groups and select the endpoints you want to scan.
Click the Actions button and select IOC scan.
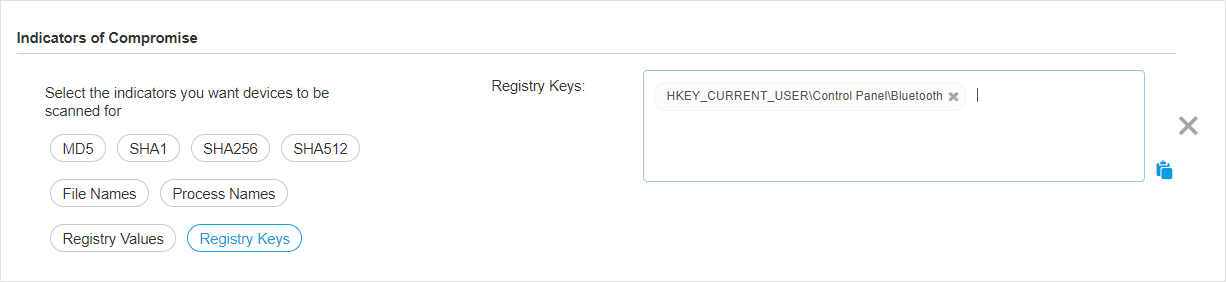
A configuration page will appear, where you need to select the type of indicators taken into account for IOC scanning.
Important
You must select at least one type of Indicator of Compromise to create a valid task.
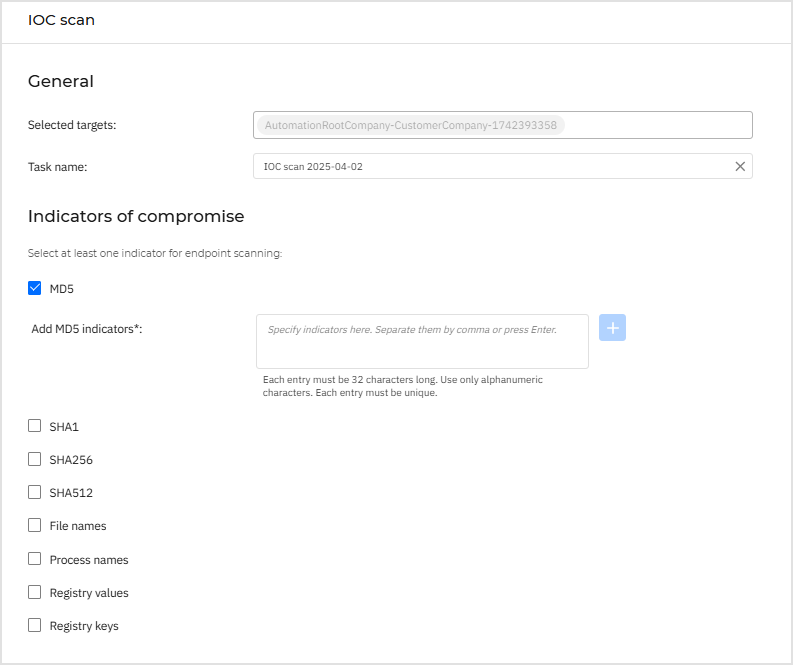
Select one or more IOC types you want to take into account for scanning and write the known IOC name in the newly added field.
You can select from the following types:
MD5
SHA1
SHA256
SHA512
File Names
Process Names
Registry Values
Registry Keys
Note
Content added inside each field must be valid. Otherwise, you will be prompted with a warning sign and a message.
Click Save to create and run the IOC scan task.
A confirmation message will appear.
You can check the task's progress in the Network > Tasks page.
Once the task has finished successfully, you can click the
 Reports button to read the report generated and assess the impact of the IOC you scanned for.
Formatting for IOC scan fields
The File Names and Process Names fields accept as input any of the following:
file names or process names, for example,
malware.exeabsolute file paths, for example,
C:\Users\User1\Downloads\malware.exefile paths that contain:
variables, for example,
%AppData%\Malware\malware.exeThese variables refer to Windows Known Folders. Only use these variables at the beginning of the file path.
wildcard characters, for example,
**\AppData\**\*.exeThere are three types of supported wildcard characters:
?- matches any one character*- matches zero or more characters, excluding the\and/characters.**- matches zero or more characters, including the\and/characters.
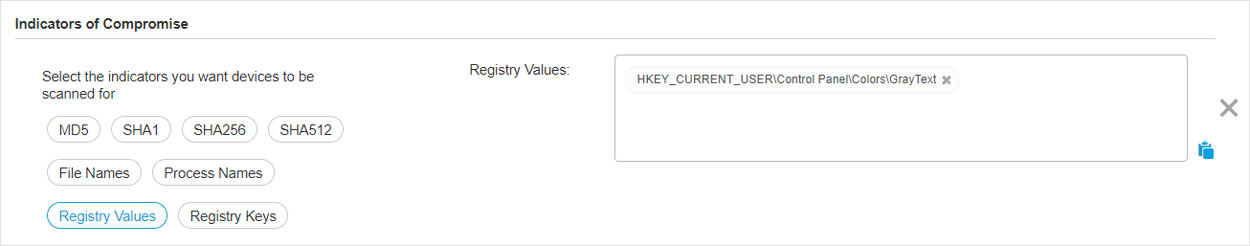
Use the Registry Values field to scan for registry value names. Your input must contain the full path to the registry value. See the example below.
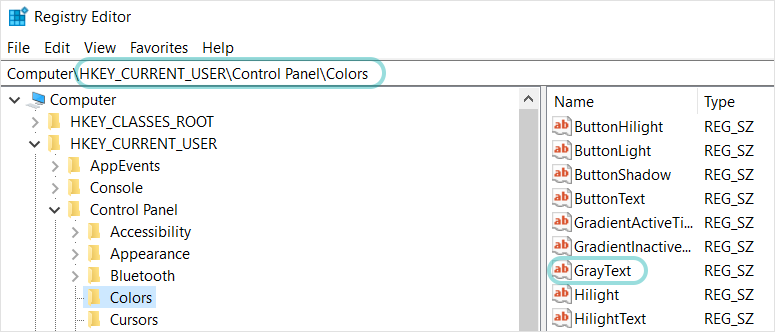
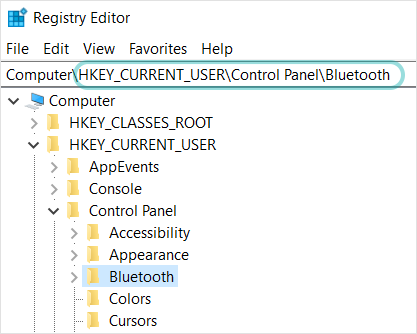
Use the Registry Keys field to scan for registry keys and subkeys. Your input must contain the full path to the registry key or subkey. See the example below.
IOC scan limitations
Valid file extensions for IOCs added to the task include: exe, dll, com, scr, jar, msi, msc, bat, ps1, vbs, vbe, js, jse, wsf, wsh, psc1, lnk, doc, docx, docm, xls, xlsx, xlsm, ppt, pptx, pptm, eml, rtf, pdf, html, ppsx, pps, ppsm, pot, potx, potm, ocx, sys, fnr, fne, and pif.
The Scan for IOC task will scan the following locations:
%Windows%\System32\Drivers%Windows%\System32\WindowsPowerShell\v1.0%Windows%\system32\config\systemprofile\AppData%Windows%\System32\Tasks%Windows%\System32\wbem%Windows%\SysWOW64\WindowsPowerShell\v1.0%Windows%\SysWOW64\config\systemprofile\AppData%Windows%\SysWOW64\sysprep%Windows%\Scripts%Windows%\System%Windows%\Web%Users%
Important
The IOC scan tasks will not run / will fail on endpoints in the following situations:
The endpoint does not have a Windows operating system.
The endpoint's Bitdefender agent license is invalid.
The EDR module is not installed in the security agent installed on the target endpoints.
More than 100 Scan for IOC tasks are currently in queue.
Invalid data is entered by user in the IOC scan task configuration page.
Risk scan
Exchange scan
You can remotely scan the database of an Exchange Server by running an Exchange scan task.
To be able to scan the Exchange database, you must enable on-demand scanning by providing the credentials of an Exchange administrator. For more information, refer to Exchange Store Scanning.
To scan an Exchange Server database:
Log in to GravityZone Control Center.
Go to the Network page from the left side menu.
From the table, select the target Exchange Server.
Select the checkbox of the Exchange Server whose database you want to scan.
Click the Actions button at the upper side of the table and select Exchange scan. A configuration window will appear.
Configure the scan options:
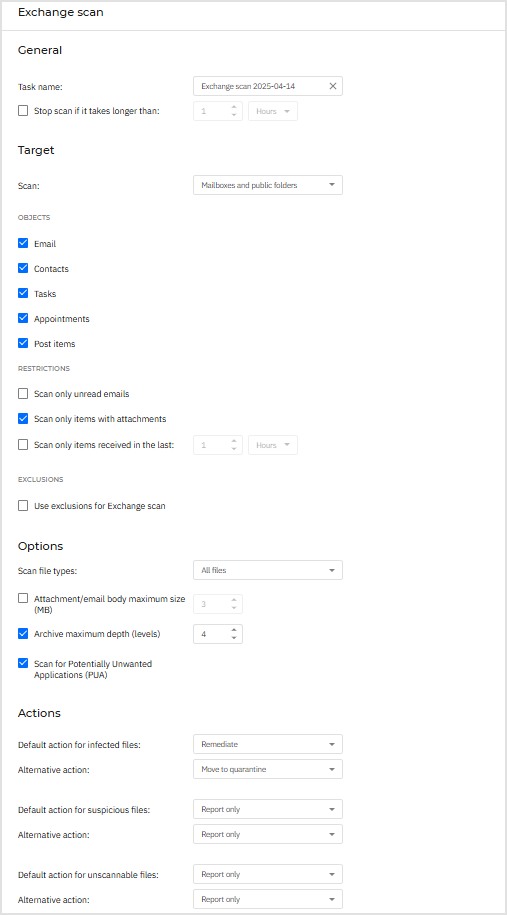
General. Enter a suggestive name for the task.
For large databases, the scan task may take a long time and may impact the server performance. In such cases, select the checkbox Stop scan if it takes longer than and choose a convenient time interval from the corresponding menus.
Target. Select the containers and objects to be scanned. You can choose to scan mailboxes, public folders or both. Beside emails, you can choose to scan other objects such as Contacts, Tasks, Appointments and Post Items.
You can furthermore set the following restrictions to the content to be scanned:
Only unread messages
Only items with attachments
Only new items, received in a specified time interval
For example, you can choose to scan only emails from user mailboxes, received in the last seven days.
Select the Exclusions checkbox, if you want to define scan exceptions. To create an exception, use the fields from the table header as follows:
Select the repository type from the menu.
Depending on the repository type, specify the object to be excluded. You can enter only one item at a time. If you have several items of the same type, you must define as many rules as the number of items.
Repository type
Object format
Mailbox
Email address
Public folder
Folder path, starting from the root
Database
The database identity
Note
To obtain the database identity, use the Exchange shell command:
Get-MailboxDatabase | fl name,identity.Click the Add button at the upper side of the table to save the exception and add it to the list.
To remove an exception rule from the list, click the corresponding Delete button.
Options. Configure the scan options for emails matching the rule:
If you want to scan only files with specific extensions, you have two alternatives:
User defined extensions, where you must provide only the extensions to be scanned.
All files, except specific extensions, where you must enter only the extensions to be skipped from scanning.
Scan file types. Use this option to specify which file types you want to be scanned. You can choose to scan all files (regardless of their file extension), application files only, or specific file extensions you consider to be dangerous. Scanning all files provides the best protection, while scanning only applications is recommended for a quicker scan.
Note
Application files are far more vulnerable to malware attacks than other types of files.
You can further refine how the scan is performed:
Attachment / email body maximum size (MB). Select this checkbox and enter a value in the corresponding field to set the maximum accepted size of an attached file or of the email body to be scanned.
Archive maximum depth (levels). Select the checkbox and choose the maximum archive depth from the corresponding field. The lower the depth level is, the higher the performance and the lower the protection grade.
Scan for Potentially Unwanted Applications (PUA). Select this checkbox to scan for possibly malicious or unwanted applications, such as adware, which may install on systems without user’s consent, change the behavior of various software products and lower the system performance.
Actions. You can specify different actions for the security agent to automatically take on files, based on the detection type. The detection type separates the files into three categories:
Infected files. Bitdefender detects files as infected through various advanced mechanisms, which include malware signatures, machine learning and artificial intelligence (AI) based technologies.
Suspicious files. These files are detected as suspicious by the heuristic analysis and other Bitdefender technologies. These provide a high detection rate, but the users must be aware of certain false positives (clean files detected as suspicious) in some cases.
Unscannable files. These files cannot be scanned. Unscannable files include but are not limited to password-protected, encrypted or over-compressed files.
For each detection type, you have a default or main action and an alternative action in case the main one fails. Though not recommended, you can change these actions from the corresponding menus. Choose the action to be taken:
Remediate. Removes the malware code from infected files and reconstructs the original file. For particular types of malware, disinfection is not possible because the detected file is entirely malicious. It is recommended to always keep this as the first action to be taken on infected files. Suspicious files cannot be disinfected, because no disinfection routine is available.
Reject / Delete email. On servers with Edge Transport role, the detected email is rejected with a 550 SMTP error code. In all other cases, the email is deleted without any warning. It is advisable to avoid using this action.
Delete file. Deletes the attachments with issues without any warning. It is advisable to avoid using this action.
Replace file. Deletes the files with issues and inserts a text file that notifies the user of the actions taken.
Move file to quarantine. Moves detected files to the quarantine folder and inserts a text file that notifies the user of the actions taken. Quarantined files cannot be executed or opened; therefore, the risk of getting infected disappears. You can manage quarantine files from the Quarantine page.
Note
The quarantine for Exchange Servers requires additional hard-disk space on the partition where the security agent is installed. The quarantine size depends on the number of items stored and their size.
Report only. No action will be taken on detected files. These files will only appear in the scan log. Scan tasks are configured by default to ignore suspicious files. You may want to change the default action in order to move suspicious files to quarantine.
You can view and manage the task on the Network > Tasks page. For more information, refer to Viewing and managing tasks.
Install agent
To protect your endpoints with the Bitdefender security agent, you must install it on each of them.
Warning
The first endpoint on which you install protection must have Relay role, otherwise you will not be able to remotely install the security agent on other endpoints in the same network.
The Relay endpoint must be powered-on and online in order for the connected agents to communicate with Control Center.
Once you have installed a Relay agent, it will scan your network and show all the entities.
The Bitdefender protection can then be installed on endpoints remotely from Control Center.
Remote installation is performed in the background, without the user knowing about it.
Warning
Before installation, be sure to uninstall existing antimalware and firewall software from computers.
Installing the Bitdefender protection over existing security software may affect their operation and cause major problems with the system.
Windows Defender and Windows Firewall will be turned off automatically when installation starts.
If you want to deploy the security agent on a computer with Bitdefender Antivirus for Mac 5.X, you first must remove the latter manually. For the guiding steps, refer to Deploying Bitdefender Endpoint Security Tools on a machine with Bitdefender Antivirus for Mac.
When deploying the agent through a Linux Relay, the following conditions must be met:
The Relay endpoint must have installed the Samba package (
smbclient) version 4.1.0 or above and thenetbinary/command to deploy Windows agents.The
netbinary/command is usually delivered with the samba-client and / or samba-common packages. On some Linux distributions (such as CentOS 7.4), thenetcommand is only being installed when installing the full Samba suite (Common + Client + Server). Make sure that your Relay endpoint has thenetcommand available.Target Windows endpoints must have Administrative Share and Network Share enabled.
Target Linux and macOS endpoints must have SSH enabled and firewall disabled.
To run a remote installation task:
Log in to GravityZone Control Center.
Go to the Network page from the left side menu.
Select the desired group from the left-side pane.
The entities contained in the selected group are displayed in the right-side pane table.
Optionally, you can apply filters to display unmanaged endpoints only. Click the Filters menu and select the following options: Unmanaged and All items recursively.
When working with EC2 instances, you can also add the EC2 Instances option in the Filters menu.
Select the entities (endpoints or groups of endpoints) on which you want to install protection.
Click the Actions button at the upper side of the table and select Install agent.
The Install agent page is displayed.
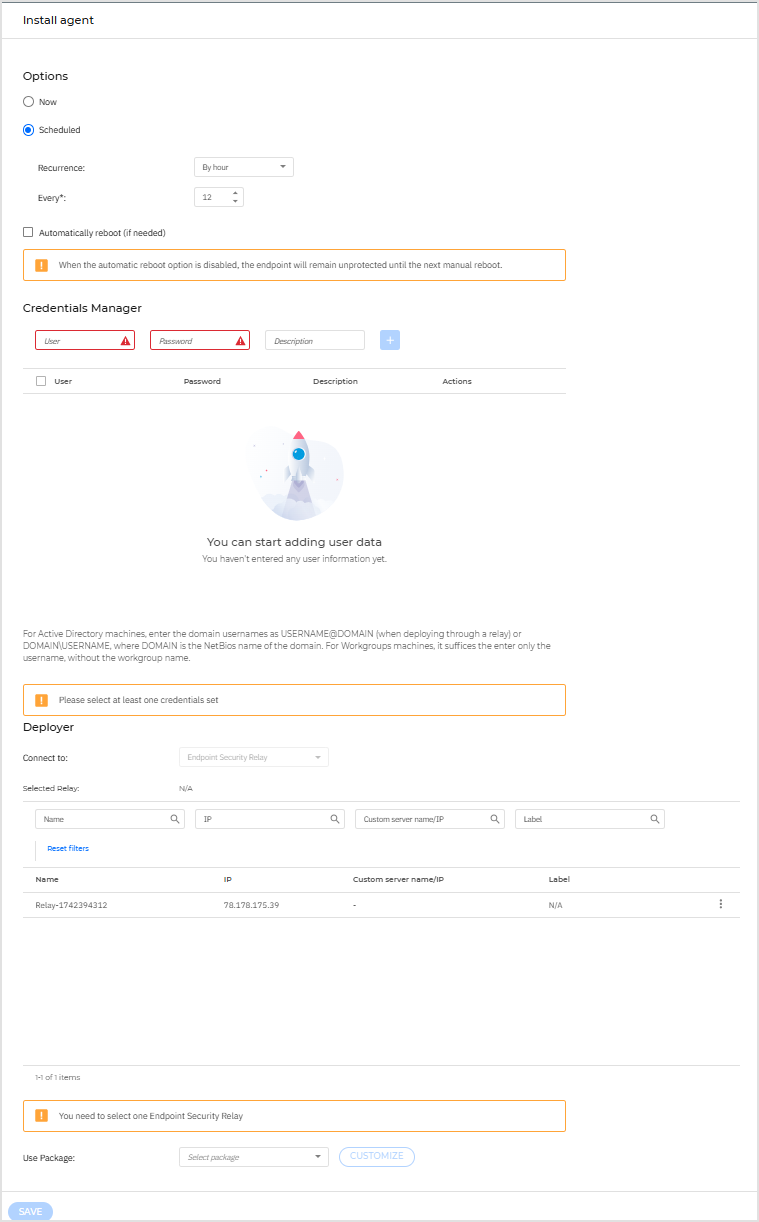
Under Options section, configure the installation time:
Now, to launch the deployment immediately.
Scheduled, to set up the deployment recurrence interval. In this case, select the time interval that you want (hourly, daily or weekly) and configure it according to your needs.
For example, when certain operations are required on the target machine before installing the client (such as uninstalling other software and restarting the OS), you can schedule the deployment task to run every 2 hours. The task will start on each target machine every 2 hours until the deployment is successful.
If you want target endpoints to automatically restart for completing the installation, select Automatically reboot (if needed).
Under the Credentials Manager section, specify the administrative credentials required for remote authentication on target endpoints. You can add the credentials by entering the user and password for each target operating system.
Important
For Windows 8.1 stations, you need to provide the credentials of the built-in administrator account or a domain administrator account.
To add the required OS credentials:
Enter the user name and password of an administrator account in the corresponding fields from the table header.
If computers are in a domain, it suffices to enter the credentials of the domain administrator.
Use Windows conventions when entering the name of a user account:
For Active Directory machines use these syntaxes:
username@domain.comanddomain\username. To make sure that entered credentials will work, add them in both forms (username@domain.comanddomain\username).For Workgroup machines, it suffices to enter only the user name, without the workgroup name.
Optionally, you can add a description that will help you identify each account more easily.
Enter the user name of an administrator account in the corresponding fields from the table header.
Use Windows conventions when entering the name of a domain user account, for example,
user@domain.comordomain\user. To make sure that entered credentials will work, add them in both forms (user@domain.comanddomain\user).Note
If computers are in a domain, it suffices to enter the credentials of the domain administrator.
Use Windows conventions when entering the name of a domain user account, for example,
user@domain.comordomain\user. To make sure that entered credentials will work, add them in both forms (user@domain.comanddomain\user).Select the authentication type from the menu:
Password, to use the administrator's password.
Upload .pem file, to use a private key.
If you authenticate using a password, enter the password in the field next to the menu.
If you authenticate using a private key, click the Browse button and select the
.pemfile containing the corresponding private key.Optionally, you can add a description that will help you identify each account more easily.
Click the
 Add button. The account is added to the list of credentials.
Specified credentials are automatically saved to your Credentials Manager so that you do not have to enter them the next time. To access the Credentials Manager, click the
 user icon in the upper-right corner of the console.
Important
If the provided credentials are invalid, the client deployment will fail on the corresponding endpoints. Make sure to update the entered OS credentials in the Credentials Manager when these are changed on the target endpoints.
Select the checkboxes corresponding to the accounts you want to use.
A warning message is displayed as long as you have not selected any credentials. This step is mandatory to remotely install the security agent on endpoints.
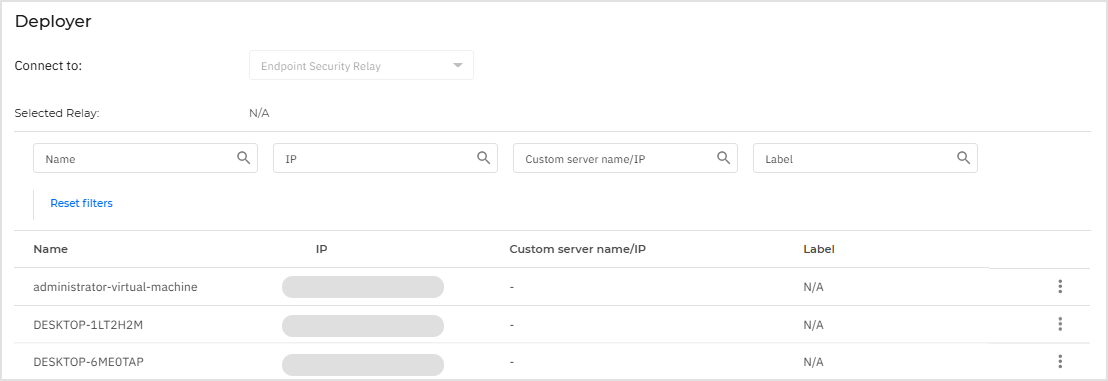
Under Deployer section, configure the Relay to which the target endpoints will connect for installing and updating the client:
All machines with Relay role detected in your network will show-up in the table available under the Deployer section. Each new client must be connected to at least one Relay client from the same network, that will serve as communication and update server. Select the Relay that you want to link with the target endpoints. Connected endpoints will communicate with Control Center only via the specified Relay.
Important
Port 7074 must be open, for the deployment through the Relay agent to work.
If target endpoints communicate with the Relay agent via proxy, you also need to define the proxy settings. In this case, select Use proxy for communication and enter the required proxy settings in the fields below.
You need to select one installation package for the current deployment. Click the Use package list and select the installation package that you want. You can find here all the installation packages previously created for your account and also the default installation package available with Control Center.
If needed, you can modify some of the selected installation package's settings by clicking the button Customize next to the Use package field.
The installation package's settings will appear below and you can make the changes that you need. To find out more about editing installation packages, refer to Create installation packages.
If you want to save the modifications as a new package, select the Save as package option placed at the bottom of the package settings list, and enter a name for the new installation package.
Click Save.
A confirmation message will appear.
You can view and manage the task in the Network > Tasks page.
If using VMware Horizon View Persona Management, it is recommended to configure Active Directory Group Policy to exclude the following Bitdefender processes (without the full path):
bdredline.exeepconsole.exeepintegrationservice.exeepprotectedservice.exeepsecurityservice.exeepupdateservice.exeepupdateserver.exe
These exclusions must apply to GravityZone as long as the security agent runs on endpoint. For details, refer to this VMware Horizon documentation page.
Intermediary statuses
During execution, the Install agent task follows these steps:
Configure task - Read policy settings and configure the task.
Resolve hostnames to IP addresses - Convert hostnames to IP addresses for efficient network communication.
Determine target OS - Identify each target’s operating system to ensure compatibility with the required installation package.
Validate deployment targets - Verify that each target has the necessary attributes (for example: IP address, OS details). Targets missing mandatory data are excluded.
Initiate parallel task execution - Start a dedicated execution thread for each valid target to allow concurrent deployment.
Execute pre-tasks - Perform preliminary setup steps per target, such as synchronizing the deployment kit.
Download deployment kit - Retrieve the required installation package for each target.
Deploy software - Transfer installation files to the remote host, configure them, and execute the deployment.
Since deployment is time-consuming, the task must continuously report its current state to the GravityZone console to keep the network administrator informed.
Below are the defined intermediary status values:
Status | Code | Description |
|---|---|---|
| 101 | The task can run only five deployments simultaneously. To start additional deployments, it waits for the ongoing ones to complete. |
| 103 | The task starts configuration. |
| 104 | The task has completed configuration. |
| 105 | The task starts resolving target hostnames to IP addresses. |
| 106 | The task has completed resolving target hostnames to IP addresses. |
| 107 | The task starts OS detection. |
| 108 | The task has completed OS detection. |
| 109 | The task starts filtering valid targets. |
| 110 | The task has completed filtering valid targets. |
| 111 | The task starts dispatching deployment jobs on target. |
| 115 | The task starts running pre-tasks on a target. |
| 116 | The task has completed running pre-tasks on a target. |
| 117 | The task starts downloading the deployment kit. |
| 118 | The task has completed downloading the deployment kit. |
| 119 | The task starts agent installation on a target. |
| 198 | Deployment has stopped due to various reasons (for example: communication issues). |
| 199 | The task has finished execution, either successfully or with an error. |
Uninstall agent
Update agent
Upgrade agent
This task is available only when Endpoint Security agent is installed and detected in the network. Bitdefender recommends upgrading from Endpoint Security to Bitdefender Endpoint Security Tools Bitdefender Endpoint Security Tools, for a last-generation endpoint protection.
To easily find the security agents that are not upgraded, you can generate an upgrade status report. For details about how to create reports, refer to Creating reports.
Reconfigure agent
The security agent's protection modules, roles and scanning modes are initially configured within the installation package. After you have installed the security agent in your network, you can anytime change the initial settings by sending a Reconfigure agent remote task to the managed endpoints you are interested in.
Warning
The Reconfigure agent task also updates the security agent to the latest product version. While using this task, make sure to select the existing settings you want to keep.
You can change the installation settings from the Network area or from the Endpoint Modules Status report.
To change the installation settings for one or several endpoints:
Log in to GravityZone Control Center.
Go to the Network page from the left side menu.
Select the checkboxes of entities for which you want to change the installation settings.
Click the Actions button at the upper side of the table and select Reconfigure agent.
Note
The Reconfigure agent page will not show which modules are currently installed on the endpoint.
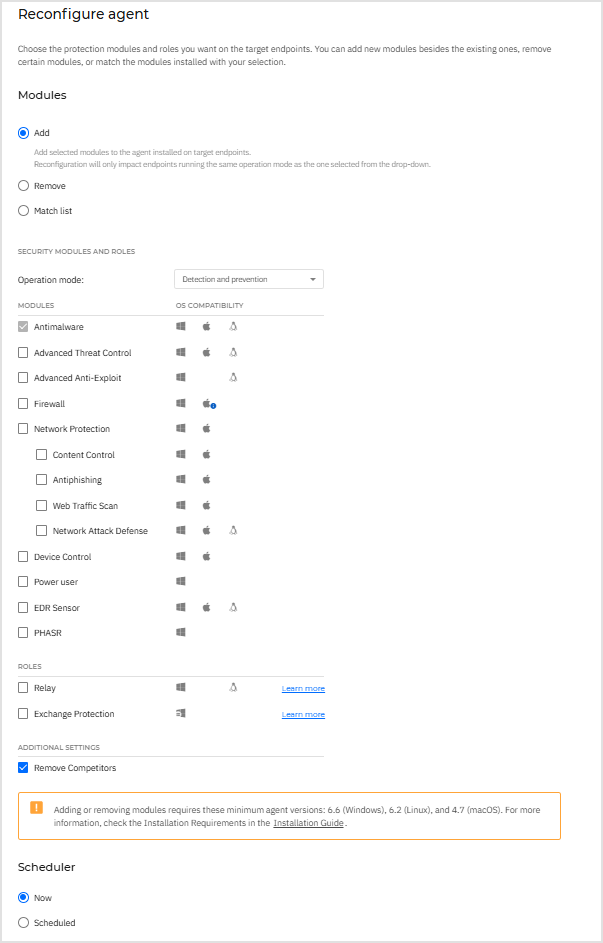
Select one of the actions below:
Add - Add new modules besides the existing ones.
Remove - Remove specific modules from the existing ones.
Note
The Show all modules option enables Admins/Partners to conveniently access and view all modules, regardless of any licence restrictions that may be in place.
You can uninstall modules that were previously installed but have become unusable or invisible due to licence changes or downgrades. This information is specific to the Remove option within the Reconfigure agent task.
Match list - Match the modules installed with your selection.
Note
Any unselected modules will be removed.
Under Scan mode select the scan mode to be used on the endpoint:
Note
Only available when selecting the Match List option.
The Scan mode option becomes available only when the selected endpoints belong to the same company and the Detection and prevention operation mode is chosen. If endpoints from different companies are selected, the Scan Mode section will not be visible.
Automatic. In this case, the security agent will automatically detect the endpoint's configuration and will adapt the scanning technology accordingly:
Central Scan in Public or Private Cloud (with Security Server) with fallback on Hybrid Scan (Light Engines), for physical endpoints with low hardware performance and for virtual machines. This case requires at least one Security Server deployed in the network.
Local Scan (with Full Engines) for physical endpoints with high hardware performance.
Local scan for EC2 instances and Microsoft Azure virtual machines.
Note
Low performance endpoints are considered to have the CPU frequency less than 1.5 GHz, or RAM memory less than 1 GB.
Custom. In this case, you can configure the scan mode by choosing between several scanning technologies for physical and virtual machines:
Central Scan in Public or Private Cloud (with Security Server), which can fallback* on Local Scan (with Full Engines) or on Hybrid Scan (with Light Engines)
Hybrid Scan (with Light Engines)
Local Scan (with Full Engines)
Default scan modes:
The default scan mode for EC2 instances is Local Scan (security content is stored on the installed security agent, and the scan is run locally on the machine). If you want to scan your EC2 instances with a Security Server, you need to configure the security agent’s installation package and the applied policy accordingly.
Note
In this case, the Bitdefender Security Server hosted in the AWS region corresponding to the target EC2 instances is automatically assigned.
The default scan mode for Microsoft Azure virtual machines is Local Scan (security content is stored on the installed security agent, and the scan is run locally on the machine). If you want to scan your Microsoft Azure virtual machines with a Security Server, you need to configure the security agent’s installation package and the applied policy accordingly.
* When using a dual engines scanning, if the first engine is unavailable, the fallback engine will be used. Resource consumption and network utilization will be based on used engines.
The default scan mode for BEST for Linux v7 when using the Bitdefender for Security Containers add-on is:
Hybrid Scan, for physical endpoints (including container hosts) and nodes (in case of Kubernetes).
Central Scan with the fallback on Hybrid Scan for endpoints (including container hosts) and nodes (in case of Kubernetes) that are either virtual machines or on a cloud infrastructure (whether IaaS or PaaS) supported by GravityZone integrations.
Note
A Security Server needs to be available for this scan to apply. If none is available the scan mode will be set to Hybrid.
For more information regarding available scanning technologies, refer to Antimalware.
Security Server Assignment.
Click the Security Server list in the table header. The list of detected Security Servers is displayed.
Certain Bitdefender Partners can share their Security Servers with their customers. Here you can view the Security Servers your Bitdefender Partner has assigned to you, provided it has this ability.
Select an entity.
Click the
 Add button from the Actions column header.
The Security Server is added to the list.
Follow the same steps to add several security servers, if available. In this case, you can configure their priority using the
 up and
  down arrows available at the right side of each entity. When the first Security Server is unavailable, the next one will be used and so on.
To delete one entity from the list, click the corresponding
 Delete button at the upper side of the table.
You can choose to encrypt the connection to Security Server by selecting the Use SSL option.
For EC2 instances, the Bitdefender Security Server hosted in the corresponding AWS region is automatically assigned, so there is no need to configure the Security Server Assignment section.
Under the Scheduler section, configure the time when the task will run:
Now, to launch the task immediately.
Scheduled, to set up the task recurrence interval. In this case, select the time interval that you want (hourly, daily or weekly) and configure it according to your needs.
For example, when other important processes are also required to run on the target machine, you can schedule the task to run every 2 hours. The task will start on each target machine every 2 hours until it is successfully done.
Configure the modules, roles and scan modes for the target endpoint as you want. For more information, refer to Install security agents - standard procedure
Note
You can only modify scan modes by using the Match list action.
Warning
Only the supported modules for each operating system will be installed.
The Firewall module is available only for supported Windows workstations.
Click Save. A confirmation message will appear.
You can view and manage the task on the Network > Tasks page. For more information, refer to Viewing and managing tasks.
Repair agent
Restart machine
Isolate endpoint
Remove from isolation
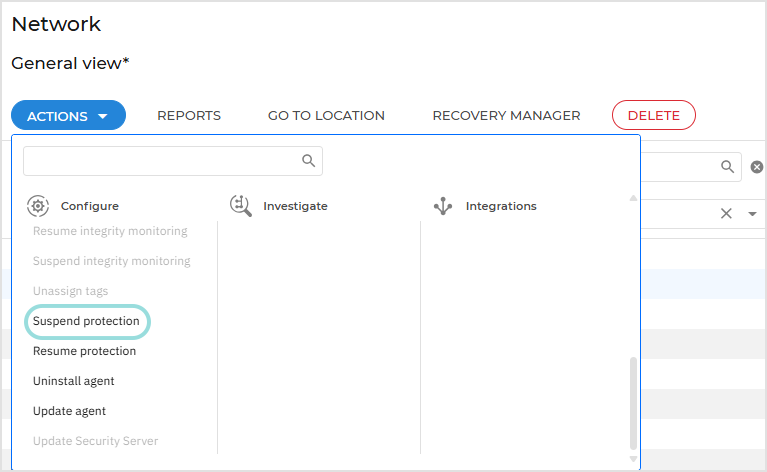
Suspend endpoint protection
In the Network section, you can manage endpoint security efficiently while maintaining full control over the suspension process.
Note
These actions are supported starting with Windows product version 7.9.20.x, macOS product version 7.20.x, and Linux product version 7.5.0.x.
To suspend endpoint protection follow these steps:
Locate the endpoint for which you want to suspend protection in the Network table.
Select the corresponding checkbox.
Open the Actions menu at the top of the table and select Suspend protection.
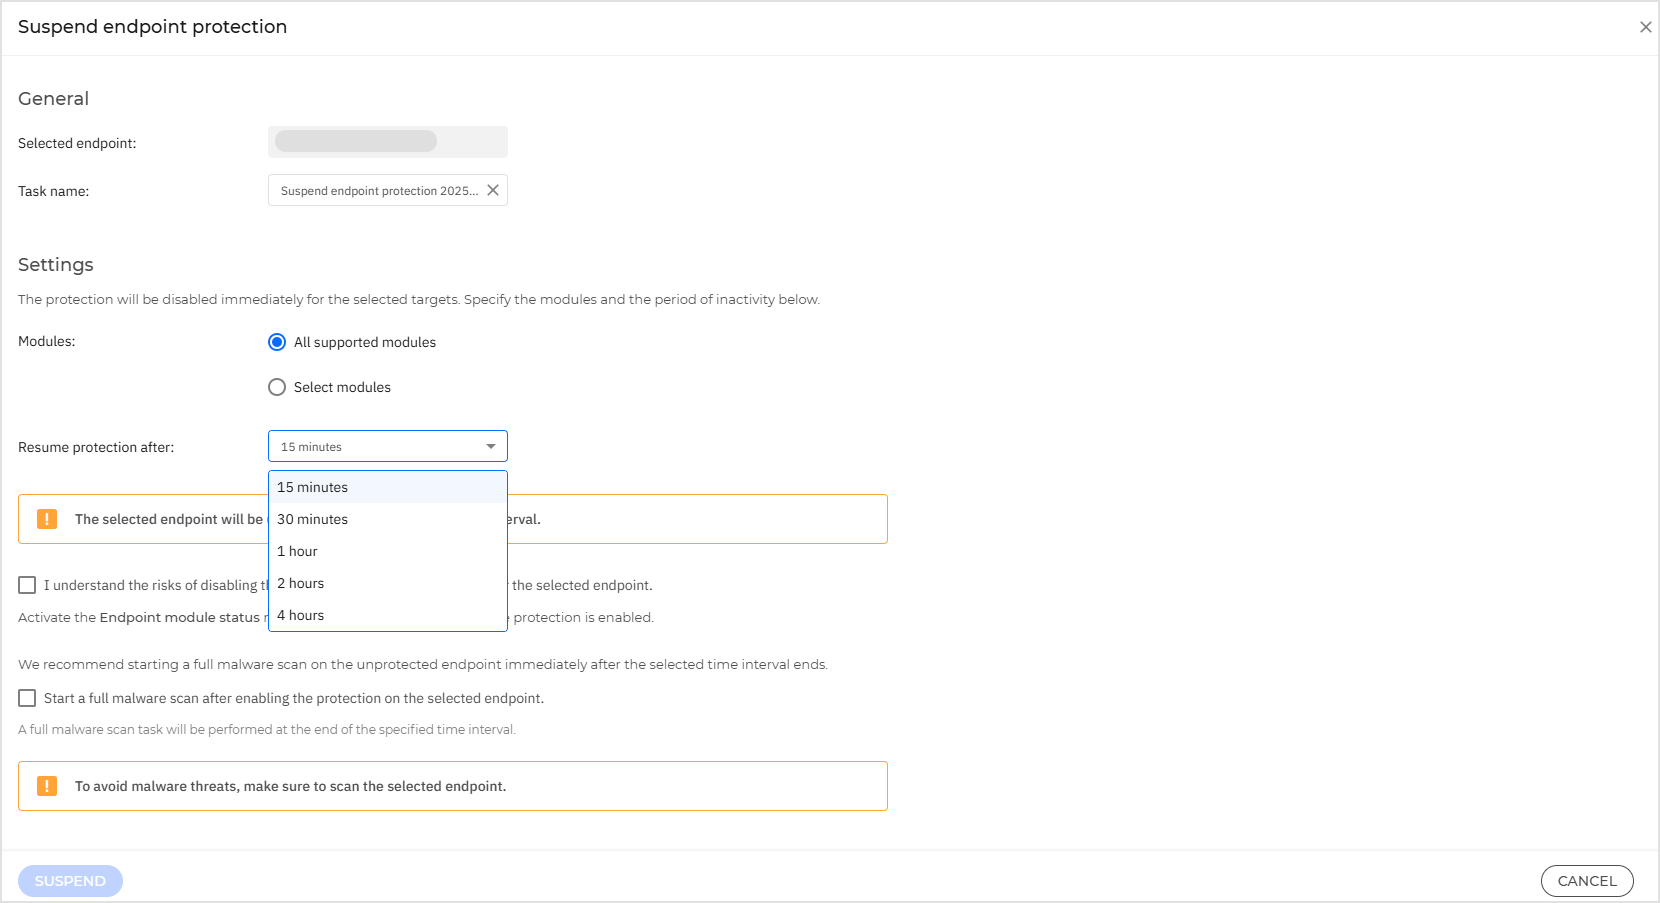
On the configuration page:
Create a task name.
Select the modules that will be suspended.
Select the time interval for the suspend action.
Click Suspend to initiate the task.
Important
The selected endpoint will be unprotected for the specified time interval, therefore we recommend starting a full malware scan on the unprotected endpoint immediately after the selected time interval ends.
On iOS devices, Web Traffic Scan relies on the Antimalware module to function. If Antimalware protection is suspended, Web Traffic Scan will also be disabled automatically until protection is resumed.
PHASR will not function properly, as it relies on the EDR module, which is suspended during this interval. As a result, behavioral data will not be collected during this time.
When troubleshooting, some protection modules cannot be deactivated. These modules are necessary for system integrity and security but do not affect user work.
The following modules are grayed out and cannot be disabled:
Device Control: manages access to external devices like USB drives and external storage. Since it does not interfere with regular operations, disabling it is unnecessary for troubleshooting.
Power User: ensures that only authorized administrators can modify security configurations. Disabling it would not aid in troubleshooting and could compromise security policies.
Full Disk Encryption: protects sensitive data at rest. Turning this off could lead to security risks, and it does not impact normal troubleshooting tasks.
Patch Management: ensures that critical security updates and patches are applied. Since patching runs in the background without disrupting user workflows, it remains enabled.
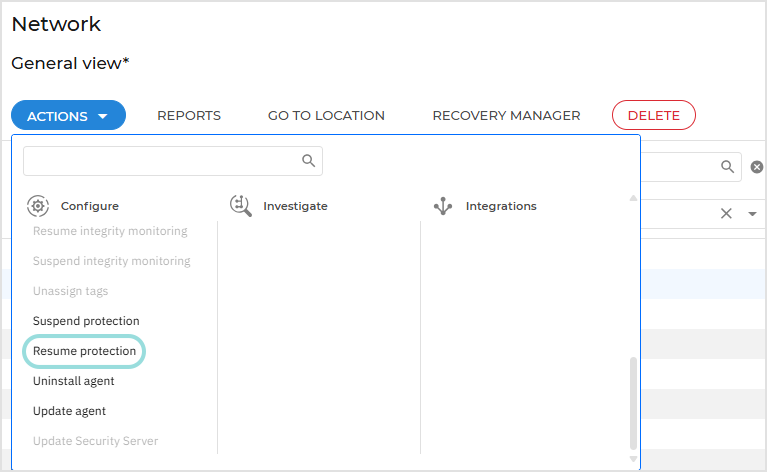
Resume endpoint protection
To resume endpoint protection follow these steps:
Locate the endpoint for which you want to resume protection in the Network table.
Select the corresponding checkbox.
Open the Actions menu at the top of the table and select Resume protection.
Click Resume to initiate the task.
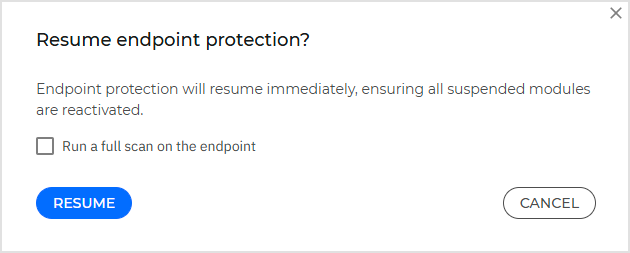
Important
We recommend starting a full malware scan on the unprotected endpoint when resuming endpoint protection.
Submit to Sandbox Analyzer
At any time, you can remotely send samples to Sandbox Analyzer from any managed endpoint running Windows or Linux.
You can only submit samples from a single endpoint at once.
Note
To submit samples that you store locally on the machine where you access GravityZone Control Center, use the options on the Manual submission page.
Creating the task
To submit a sample from an endpoint in your network, follow these steps:
Log in to GravityZone Control Center.
Go to the Network page in the GravityZone main menu.
Browse your network and select the target endpoint.
Click the Actions menu and select Submit to Sandbox Analyzer.
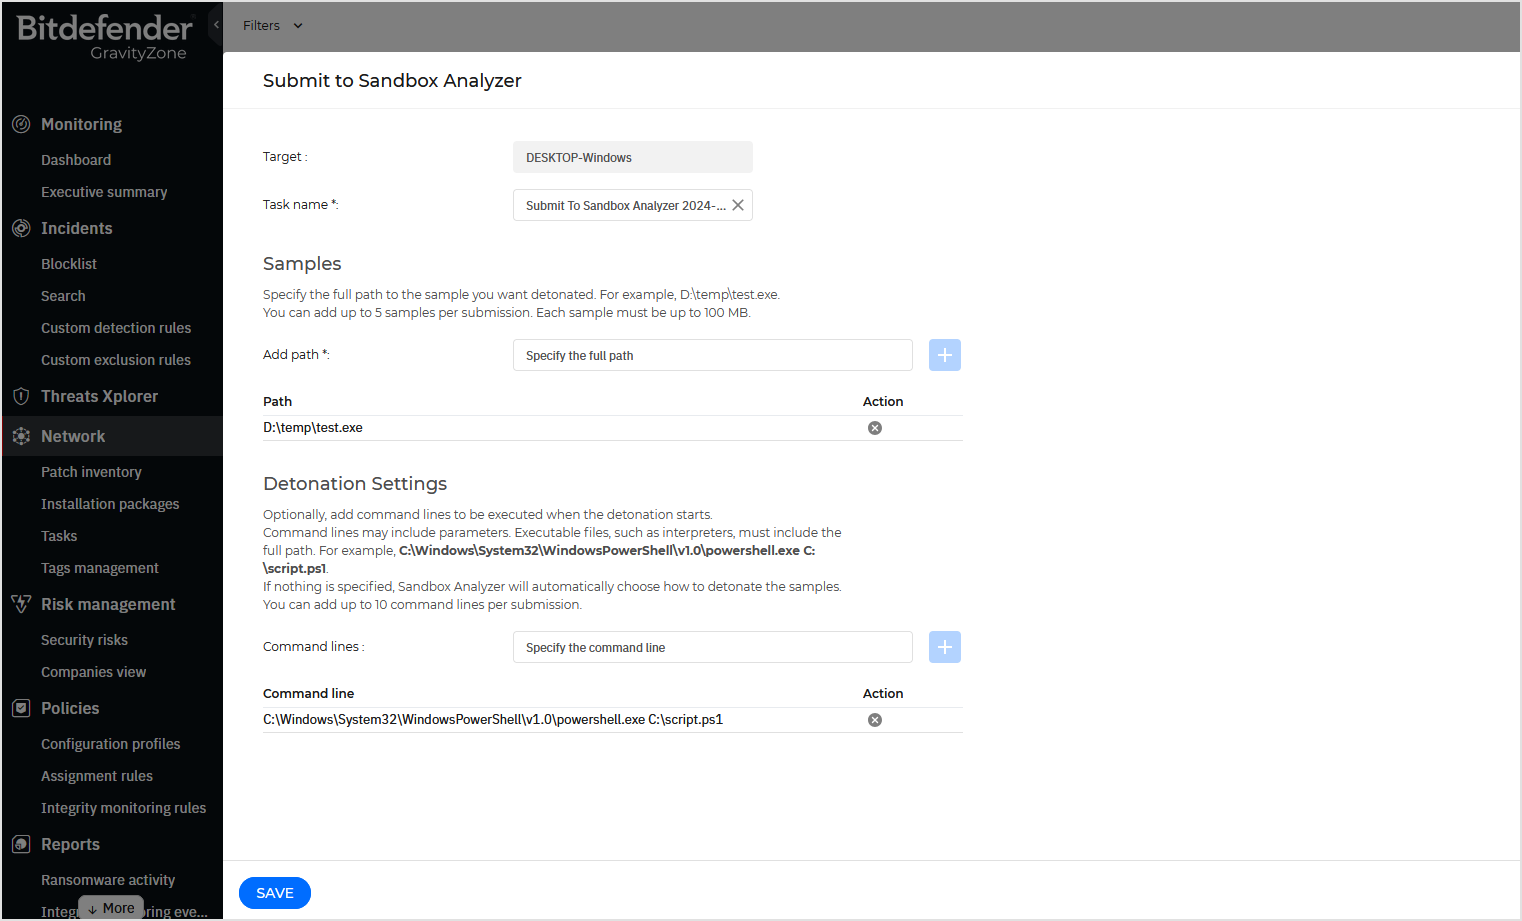
In the configuration window, fill in the following details:
Task name. By default, the task name is Submit to Sandbox Analyzer followed by date. If needed, you can change the name to find it easier on the Network > Tasks page.
The task name supports up to 512 characters.
Path. Specify the full path to the sample you want detonated.
Windows path example:
D:\temp\test.exeLinux path example:
/home/username/bin/scriptYou can add up to 5 samples per submission. Each sample must be up to 100 MB. After each path, click the
 Add button.
The path requires Windows or Linux format and supports up to 1024 characters.
Sandbox Analyzer supports archives with two levels of nesting.
Note
An easy way to get the full path is to access the Security tab in the Properties window of the sample, on the target endpoint, and copy it from there.
Command line. Optionally, add command lines to be executed when the detonation starts.
Command lines may include parameters. Executable files, such as interpreters, must include the full path.
Windows command line example:
C:\Windows\System32\WindowsPowerShell\v1.0\powershell.exe C:\script.ps1Linux command line example:
/usr/bin/bash /opt/scripts/test.shIf nothing is specified, Sandbox Analyzer will automatically choose how to detonate the samples.
You can add up to 10 command lines per submission. After each command line, click the
Add button.Each command line supports up to 4096 characters.
Click Save.
You can monitor the progress of the created task on the Network > Tasks page, under Submit to Sandbox Analyzer type.
Note
Sandbox Analyzer supports any Unicode characters.
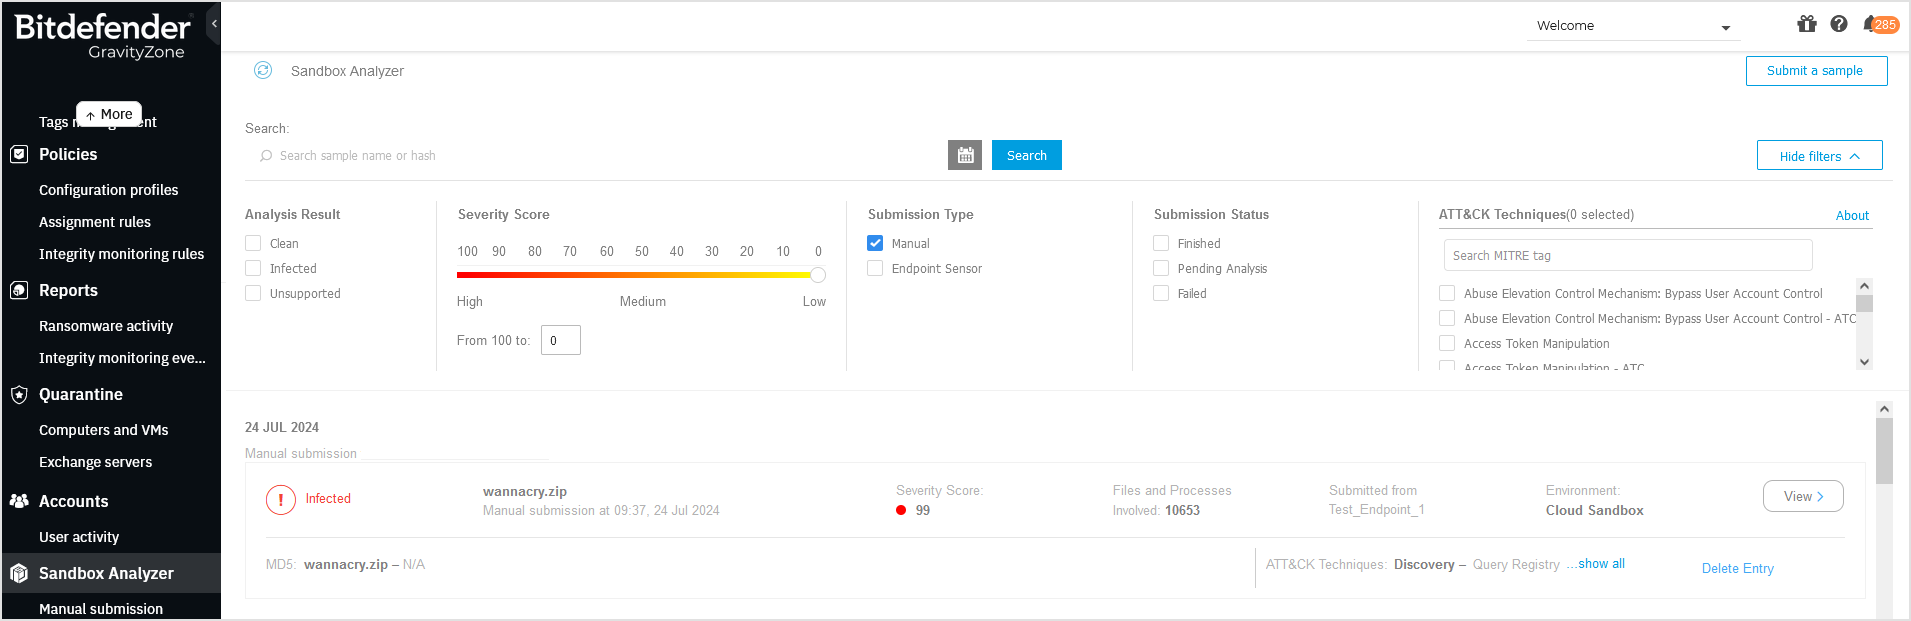
Viewing the results
Sample detonation may take several minutes. When done, you can view the results on the Sandbox Analyzer page in the GravityZone main menu.
Each detonation has dedicated submission card, with the following details:
Submission type: manual.
Company name.
Verdict: clean, infected, unsupported.
Sample path, as you provided it when creating the task.
Severity score, which indicates the threat level posed by the sample.
Files and process involved, indicated by a number.
Endpoint name, as displayed in your network.
Environment where the detonation had taken place, which is identified as Cloud Sandbox.
MD5 hash.
ATT&CK techniques identified during detonation.
For a more detailed report, click the View button on the right side of the card.
Monitoring user activity
You can review the tasks on the Accounts > User activity page, under Area: Tasks.
Run network discovery
Update security appliance
Change security appliance password
You can update the password for your security appliances (such as Security Server and Network Server) from the Network page using the Change security appliance password action, either when it expires or as a precaution.
You can update passwords for multiple Security Servers and Network Sensors simultaneously, which is useful in large GravityZone inventories. Although the task will run on all selected Security Servers and Network Sensors, it will finish successfully only on those instances that share the same current password. For Security Servers and Network Sensors with different current passwords, you must run separate tasks.
Note
This action applies to Security Server Multi-Platform and to Network Sensor Virtual Appliance, available with the XDR feature.
Identifying security appliances that require a password change
In GravityZone environments with multiple Security Server and Network Sensor instances, you can identify those whose passwords have expired and require updating.
To identify security appliances requiring a password change:
In the GravityZone Control Center left-side menu, go to the Network page.
In the list of smart views from the left-side panel, click Password change required.
This view already includes all necessary filters to show Security Servers and Network Sensors with expired passwords.
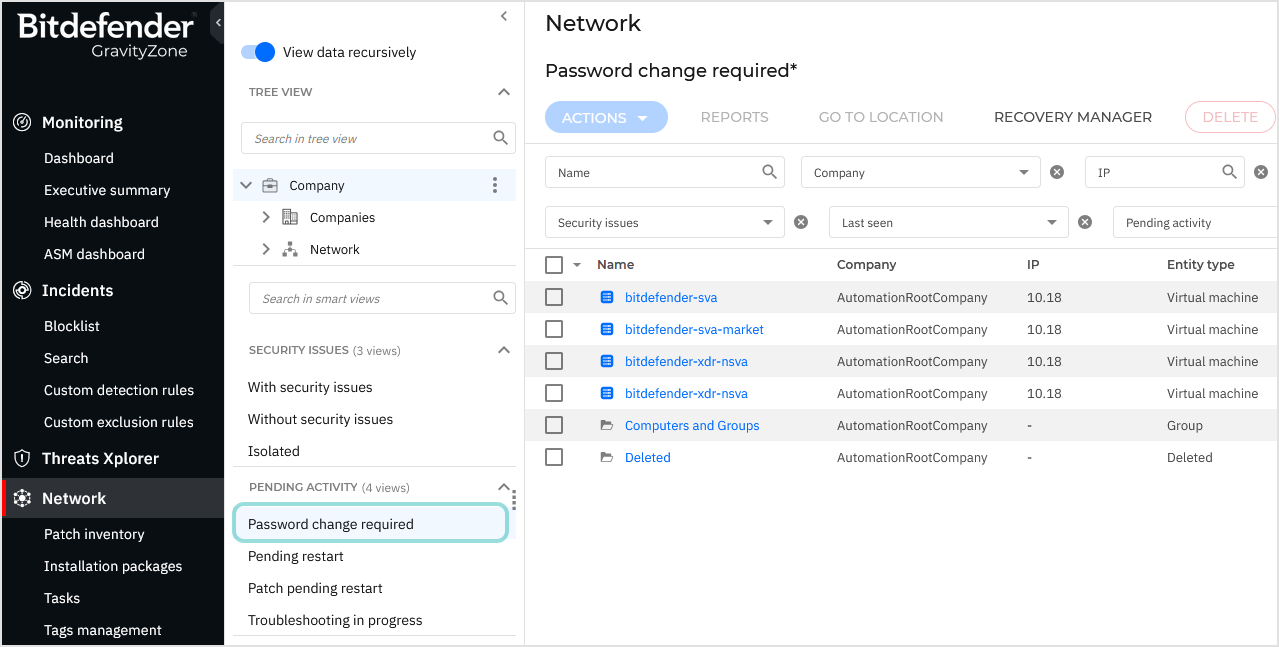
Alternatively, on the Network page, you can manually set filters as follows:
Company - Select the company you are interested in.
Entity type - Select Physical machine and Virtual machine.
Pending activity - Select Password change required.
Ensure that the View data recursively option is active.
To view the password details for a specific Security Server or Network Sensor:
In the Network table, click the Security Server or Network Sensor name.
On the General tab of the details page, locate the Password details section, which includes:
Last password change date
Current password expiry date
Maximum password age (in days)
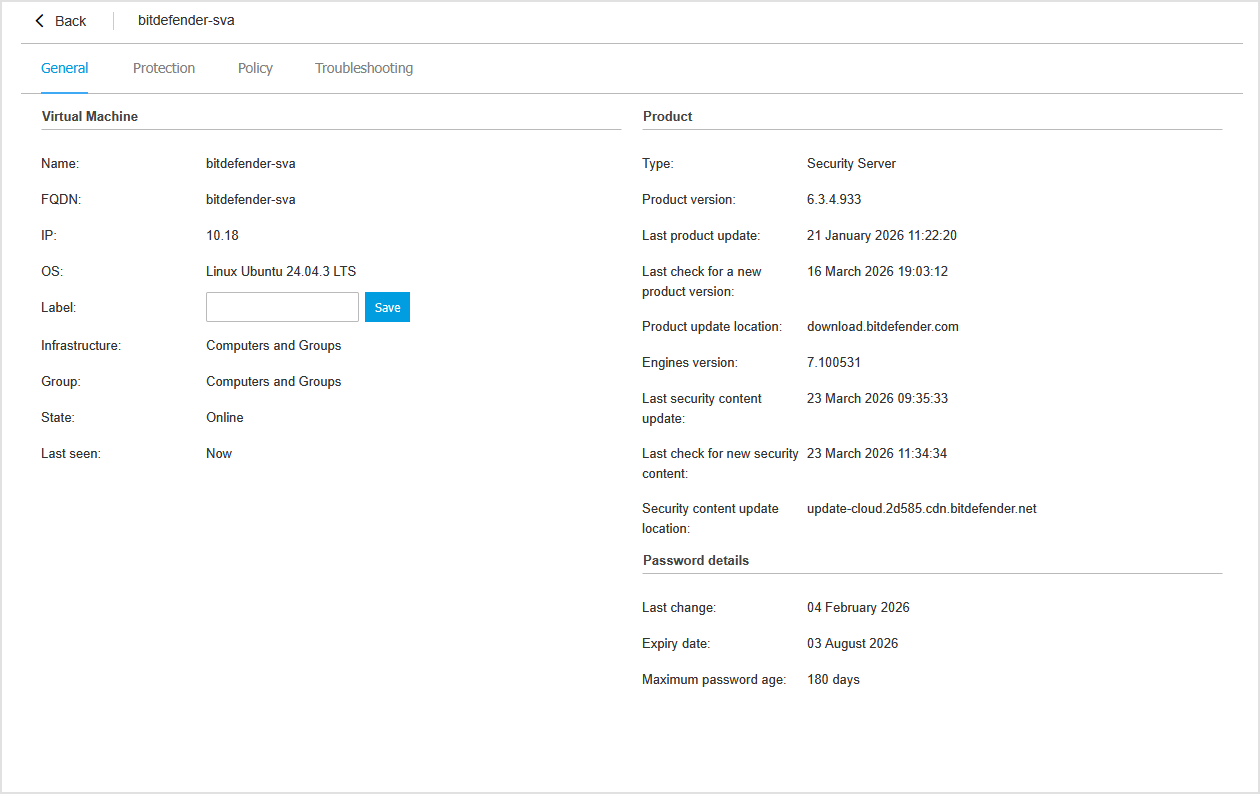
Note
In environments with multiple Security Servers and Network Sensors, they may share the same name or IP address, making them difficult to distinguish on the Network or Tasks pages. To prevent confusion, assign unique hostnames to each instance.
Changing the password
After identifying the security appliances that require updates:
Select the Security Servers and Network Sensors in the table.
Click the Actions button at the top of the table and select Change security appliance password under the Configure category.
Alternatively, right-click the selected Security Servers, go to Configure, and then click Change security appliance password.
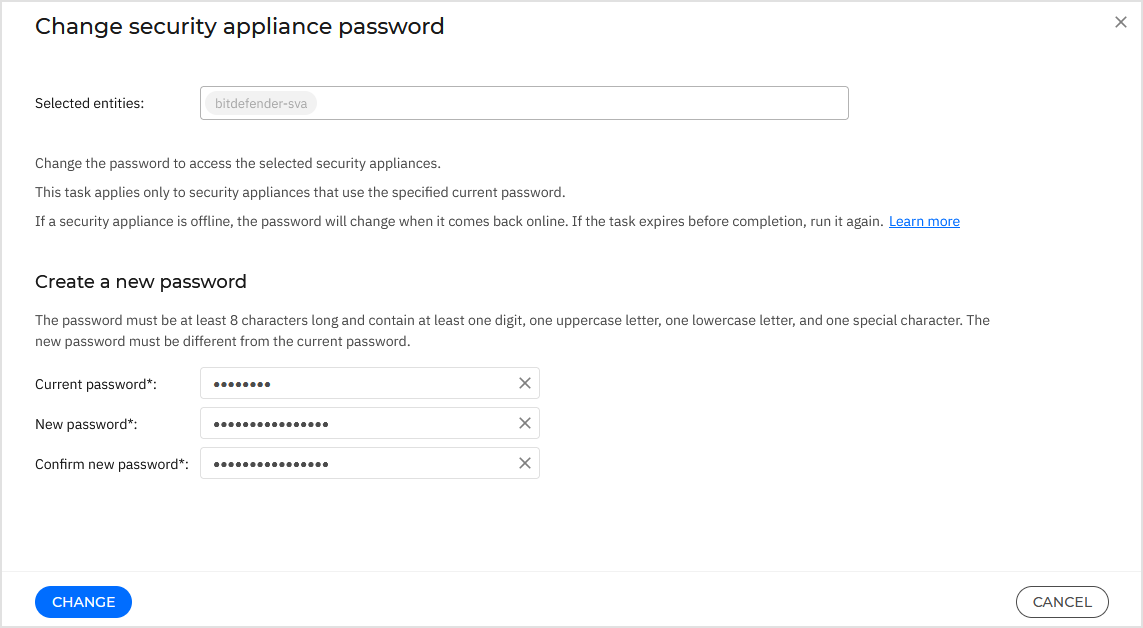
On the configuration page:
Enter your current password.
The default Security Server and Network Sensor password at the installation time is
sve.Note
If you forgot the Security Server or Network Sensor password, you can reset it. For details, refer to Reset the Security Server password.
Enter your new password.
The password must be at least 8 characters long and contain at least one digit, one uppercase letter, one lowercase letter, and one special character.
Confirm the new password.
Note
The default password expiration period is 90 days. You can extend this duration or disable password expiration in the Configuration > Security Server settings section for both Security Server and Network Sensor Virtual Appliance.
Click Change to create the task.
Note
This task applies only to Security Servers and Network Sensors that use the specified current password. To update other Security Servers and Network Sensors with different passwords, run the task again for those instances.
If a Security Server or Network Sensor is offline, the password will change when it comes back online. If the task expires before completion, run it again.
Monitoring the task
You can view and manage password change tasks on the Network > Tasks page.
Depending on your environment, the task may take several minutes to complete, as it must communicate with the target Security Servers and Network Sensors.
If a task fails, review the error messages and create a new task from the Actions menu on the Network page.
The task cannot be restarted from the Tasks page. Instead, you must create a new task from Network.
Monitoring user activity
All Security Server password changes are recorded on the User activity page.
To view them:
In the GravityZone Control Center left-side menu, go to the Accounts > User activity page.
Configure the filters as follows:
Company - Select the company you are interested in.
Action - Select Created.
Area - Select Tasks.
Click Search.
In the results list, click an entry to view details.