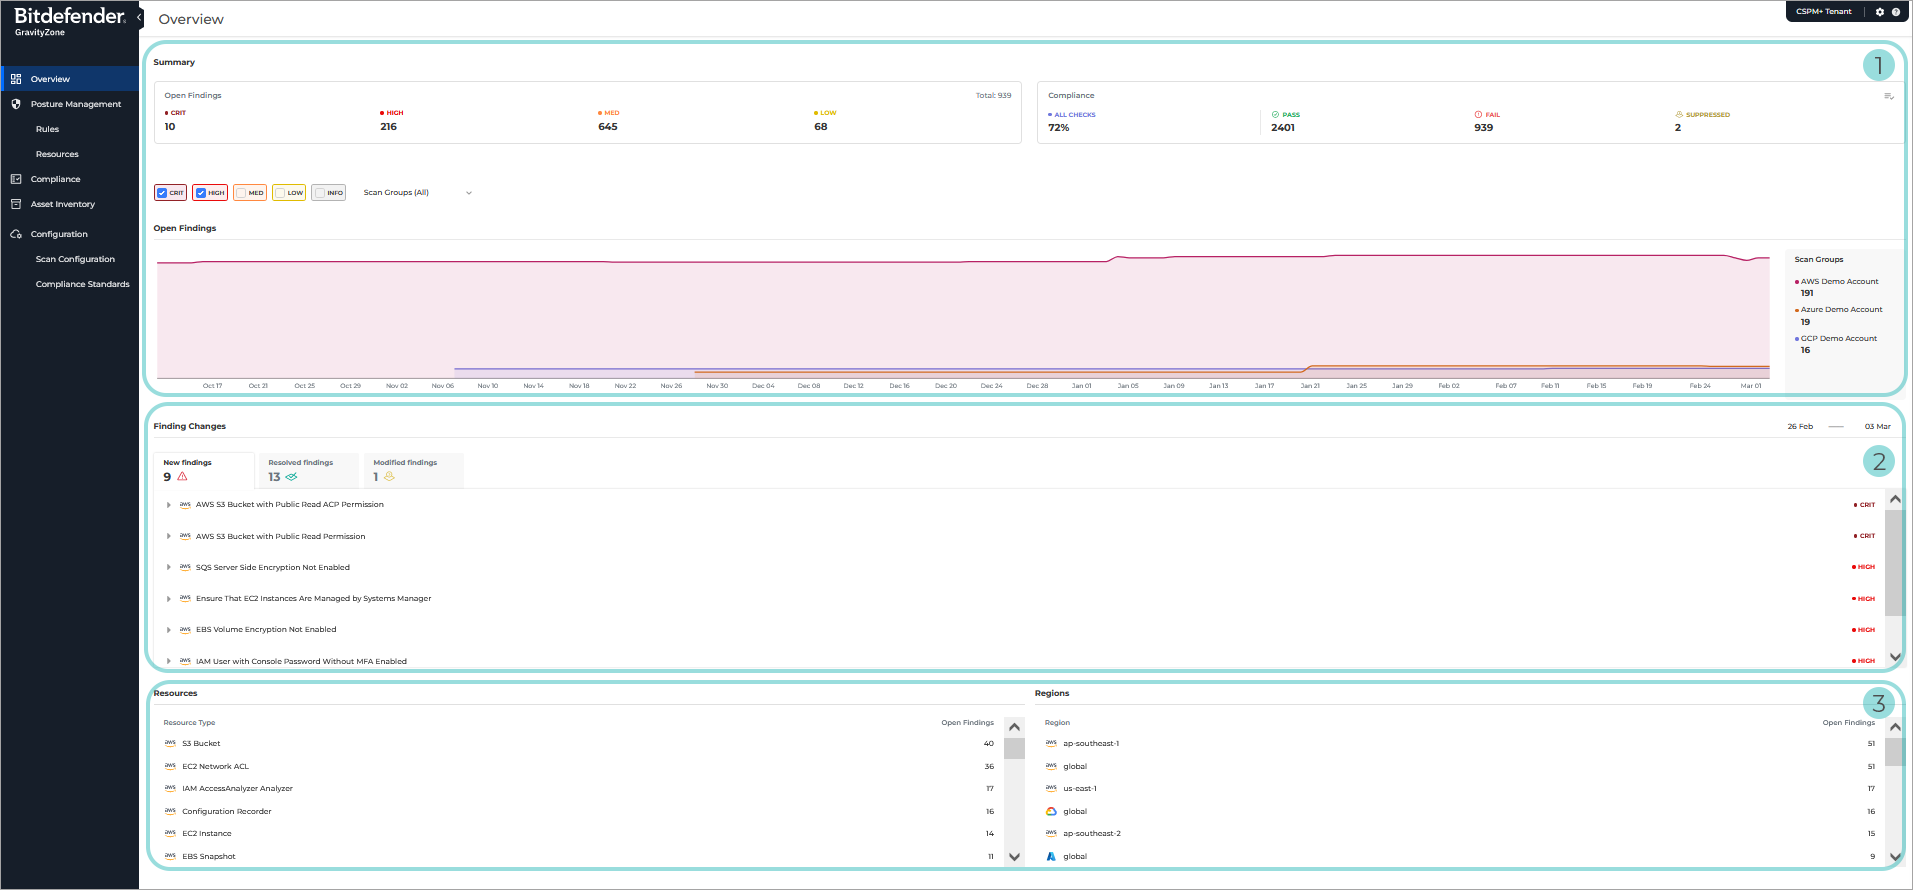
The Overview dashboard
The GravityZone Cloud Security Posture Management Overview dashboard consolidates the findings from your various cloud accounts and gives you a high-level understanding of your cloud security posture. With one glance, you can view a snapshot of your cloud security state at any particular point in time.
With the Overview dashboard, you are be able to:
Display the breakdown of your cloud infrastructure by account, region, and resource type.
Assess which parts of it need special attention.
Show the overall trend of your security posture over time.
Provide insights that facilitate quick decisions that can impact the bottom line.

Summary

Open Findings statistics
The Open Findings section shows the current total of all the open findings by severity level. Open findings refer to identified failed checks which have not been suppressed by the users.
Compliance
The Compliance section shows your overall compliance posture for a selected compliance standard. It also allows you to choose which compliance standard to use as a benchmark in this section.
You can click on the Filter
 icon to select the compliance standard you want to use as a benchmark.
Page filters
Use these filters to customize the information that is being displayed on the page:
Severity levels

You can select the checkboxes to customize what type of findings you want included in the graph, based on severity level.
For more information on severity levels, refer to this KB article.
Scan groups

Click on the filter button next to the severity levels to select the scan groups you want to display findings for.
Open findings graph
The graph provides an interactive graphical representation of the findings over a specific time frame.
Scan groups
This section displays a list of scan groups, based on the number of currently open findings.
Important
These filters will affect all the information displayed on the page.
Finding Changes
This section identifies all changes in their security posture over a specific period of time, customizable using the Time interval filter.

Use the buttons in the lower right side of the Summary section to select the time interval for which you want to display findings.
There are 3 tabs available:
Important
All tabs and classifications are linked to the time selected in the Time Interval filter, and not the current day. For example, New Findings display findings that were considered new for the reporting period selected in the filter, but for the current date might be considered Resolved or Modified.
New Findings - Displays all recently created open findings.
This category includes:
Scans that ran for the first time and failed.
Scans that have previously passed but have now failed.
Resolved Findings - Displays rule checks that have previously failed but no longer do so.
These include:
Checks that were previously failing but are now passing.
Rule checks whose resource context it was referencing is missing or deleted.
Failing rule checks that are no longer being suppressed.
Modified Findings - Open findings whose severity level got changed, or whose status got suppressed through Vulnerability Management. This tab allows you to:
Understand what the changes are so further investigation can happen if needed.
Know which issues to prioritize by looking at severity and status.
Confirm that issues have been resolved.
Review changes to a check’s severity or status.
It also gives you metrics you can present to your organization’s leadership team related to your security posture, such as:
How many new issues were introduced over a period of time.
How many issues were addressed over a period of time.
Resources & Regions
This section displays several groups of findings, split into groups, based on the following criteria:
Resources - displays a list of existing resource types, based on the number of open findings originating form each one.
Regions - displays a list of existing regions, based on the number of open findings originating form each one.