Monitoring and managing security for MSP Partners
To have access to these features for a managed company, they need to have the Your Bitdefender partner can assist you with security management setting enabled.
Monitor security
Dashboard
The Control Center Dashboard is a customizable visual display providing a quick security overview of all protected endpoints and network status.
The default portlets that are provided by GravityZone include a wide range of information, both for your own company and for managed companies.
Important
By default, data from the current day is displayed on the dashboard. If the no information is displayed on a particular portlet, change the data displayed to 1 week or 1 month in the past to include more information. For more information, refer to Dashboard.
You can create additional portlets that gather data only from one specific company:
Log in to GravityZone Control Center.
Go to the Dashboard page from the left side menu.
Click the
 Add Portlet button on the upper side of the console. The configuration window is displayed.
Under the Details section, select the type of data you want to the portlet to display and add a descriptive name. There is a portlet available for each report type provided by the console. For more information refer to Report types.
Tip
We suggest including the company name in the portlet description to easily identify portlets related to a specific company.
Under the Select Target tab, select the company you want to monitor.
Click Save.
Executive Summary
Executive Summary presents a concise security overview of all protected endpoints in your network and is specially designed to help you monitor, analyze and provide executive management with easy-to-interpret data.
To display data for a specific company, click the drop down menu on the upper right side of the page and select the company you want to display data for:
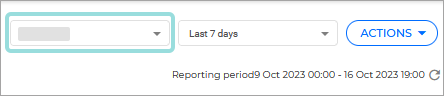
Composed mostly of widgets, it enhances visibility by offering details about endpoint modules, detections and taken actions, threat types and techniques, your company risk score, and others.
Threats Xplorer
Threats Xplorer is specially designed to offer you highly increased visibility over the detected threats in your network. The feature centralizes detection events from multiple GravityZone technologies and classifies them by category, threat type, remediation actions, and many others.
You can use the Companies filter to display data only for a specific company:
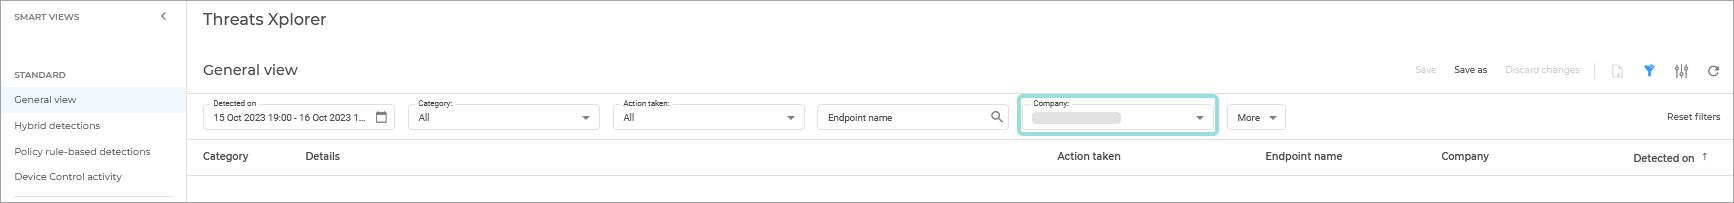
You can easily identify and analyze any event from your company over a specific time interval by using the available filters. For more information refer to Threats Xplorer.
Create and track tasks for managed companies
You can use tasks to perform remote operations on endpoints for your managed companies. To run a task on an enpoint belonging to a managed company, follow the steps below:
Log in to GravityZone Control Center.
Go to the Network page from the left side menu.
Click the Tag drop down menu on the upper side of the page and select the endpoint tag you created for your target company.
All of the company's managed endpoints are now displayed.
Select the target endpoints. You can select one or several endpoints, groups of endpoints, or companies. For more information refer to Viewing endpoint details.
Click the Tasks button at the upper side of the page and select the task you want to run.
Here is a list of tasks you can perform on a managed company's endpoints:
Task | Description | Dependencies |
|---|---|---|
The task scans endpoints in search of malware. | BEST needs to be installed on the endpoint. | |
Scan endpoints for indicators of compromise that might indicate malicious software or other security issues. ImportantWe recommend running this task immediately after you discover that a specific endpoint has been compromised. |
| |
Scan endpoints for additional risks, apart from malware. |
| |
Patch scan Scan endpoints to check specific software for missing updates. Patch install Install missing software updates on endpoints. |
| |
The task scans an exchange server in search of malware. | Bitdefender Endpoint Security Tools with Exchange Protection needs to be installed on the server. | |
The task installs a BEST agent on the endpoint according to the specifications included in the installation package selected when creating the task. | N/A | |
Remove the BEST agent from and endpoint and free up the license seat. | BEST needs to be installed on the endpoint. | |
Install the latest security update for the BEST agent on the endpoint. | BEST needs to be installed on the endpoint. | |
Customize the protection on an endpoint by adding or removing modules. | BEST needs to be installed on the endpoint. | |
Use this task to repair the BEST agent on the endpoint. | BEST needs to be installed on the endpoint. | |
Isolate an endpoint from the internet and your network. |
| |
Remove an endpoint from isolation. |
| |
Restart the endpoint. ImportantWe recommend running this task after updating BEST or cleaning malware from an endpoint. | BEST needs to be installed on the endpoint. | |
Scans the network the endpoint belongs to, to find additional endpoints. | BEST needs to be installed on the endpoint. | |
Update the Security Server software on an endpoint. | Security Server deployed on a hypervisor. |
For more details on how you configure and perform tasks, refer to this kb article.
Once tasks are created, you can monitor their progress in the Network > Tasks page:
Log in to GravityZone Control Center.
Go to the Tasks page from the left side menu.
Click the Company filter at the upper right side of the page.
Select the name of your target company.
Click Apply.
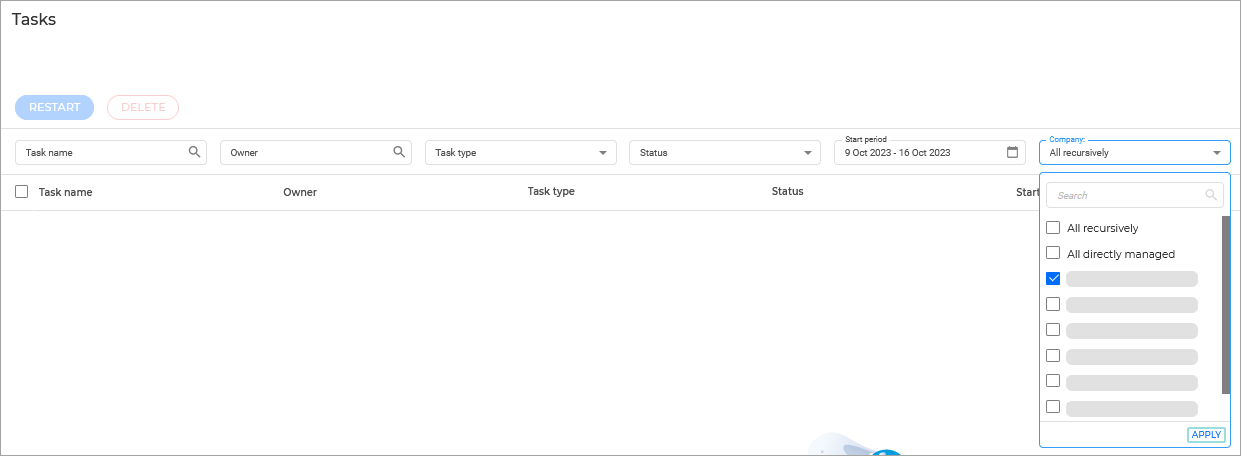
All the tasks that were requested for any of the endpoints managed by the selected company are now displayed. Click on any task name to display additional information and access additional actions. For more information refer to Viewing and managing tasks.
Create and track reports for managed companies
You can create two categories of reports:
Instant reports - Use these as a one off request to instantly display the information you are requesting. Once the report has been closed, the information will no longer be available.
Scheduled reports - You can use these type of reports to schedule periodic generation of specific reports. After you create a scheduled report, it is displayed on the Reports page, along with the date it was last generated.
To create an easily trackable scheduled report, follow the steps below:
Log in to GravityZone Control Center.
Go to the Reports page from the left side menu.
Click the
 Add button on the upper side of the table. A configuration window is displayed.
Select a report type from the menu. For more information, refer to Report types.
Enter a suggestive name for the report.
Important
Put the target company name at the start of the report name. This will allow you to filter reports based on the company name.
When choosing a name, consider the report type and target, and possibly the report options.
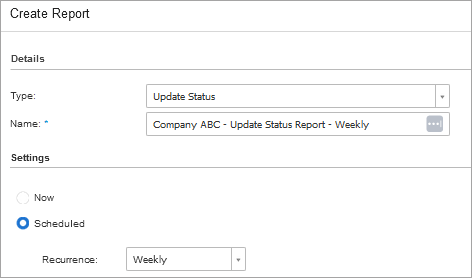
Select Scheduled to configure the report to be automatically generated at the time interval that you want:
Hourly, at the specified interval between hours.
Daily. In this case, you can also set the start time (hour and minutes).
Weekly, on the specified days of the week, and at the selected start time (hour and minutes).
Monthly, at each specified day of the month and at the selected start time (hour and minutes).
For most report types you must specify the time interval to which the contained data is referring. The report will only display data from the selected time period.
Several report types provide filtering options to help you easily find the information you are interested in. Use the filtering options under the Show section to obtain only the desired information.
For example, for an Update Status report, you can choose to view only the list of network objects that have not been updated, or the ones that need to be restarted to complete the update.
Under the Delivery section, configure the following settings:
Send email to - select this option to send a scheduled report by email and enter the email addresses that you want in the field below.
By default, the email contains an archive with both report files (PDF and CSV).
Attach files - check the boxes to customize in what format the report is sent.
Select Target. Scroll down to configure the report target. Select the company for which you want the report to be created.
Click Save.
The scheduled report will be displayed in the list on the Reports page.
For information on how to create an instant report, refer to Creating reports.
To display all scheduled reports for a specific company, follow the steps below:
Log in to GravityZone Control Center.
Go to the Reports page from the left side menu.
Under the Report name filter, type in the name of your company:
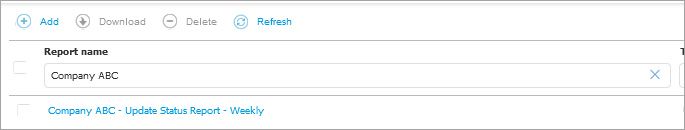
Use the other filters to further customize the type of reports that are being displayed.
Click the corresponding link in the View report column to display the report. The most recent report instance will be displayed.
To view all instances of a report, refer to Saving Reports.
For more information regarding reports, refer to Reports.
Configure notifications for managed companies
By default, notifications are sent only for your company. For you to receive notifications for a managed company, follow the steps below:
Tip
Before configuring notifications, we recommend creating a separate GravityZone user, and only using it for monitoring notifications.
Click the bell icon button
 at the right side of the menu bar to expand the Notifications panel.
Click See all notifications. A table containing all the notifications is displayed.
Click the
 Configure button at the upper side of the table.
 Note
You can also access the Notification Settings window directly using the
 Configure icon from upper-right corner of the Notification area window.
The Notification Settings window is displayed:

Add the email address where you want the notifications to be send.
Tip
Make sure you add the email address of the account you created specifically for monitoring notification.
Select the Device Name and Device FDQN checkboxes.
Select the notification you want to receive for your managed companies.
Make sure the notification is enabled.
Select the Receive notification for child companies checkbox.
Warning
Enabling this setting can result in a high number of notifications.
For more information on configuring notifications, refer to Configuring notification settings.
For additional information on a specific notification, refer to Notification types.
Tip
We recommend considering activating these settings for the following notifications:
Malware Outbreak
Advanced Anti-Exploit
Antiphishing event
Firewall event
ATC/IDS event
Data Protection event
HyperDetect activity
Network Incidents event
New Investigation Files Activity
Sandbox Analyzer Detection
Missing patch issue
New Incident
Ransomware Detection
New incident assigned to you
Password expiration reminder
Account lockout enabled
Password expiration enabled
Account locked out
Click Save.
You will now receive the selected notifications for all your managed companies.