The PHASR dashboard
Exploring widgets
Data collected by PHASR is organized into categories, analyzed, and presented in relevant widgets. You can find these widgets on the Monitoring > ASM dashboard page when PHASR is selected in the smart view.
This page provides a range of widgets that offer detailed insights into your company’s potential attack structure, identifying areas of exposure and enhancing visibility into possible attack vectors. It highlights easily actionable recommendations that will reduce the attack surface exposure. The page also includes links to information relevant to recommendations enabling more efficient and targeted mitigation efforts.
The feature makes use of the following widgets:
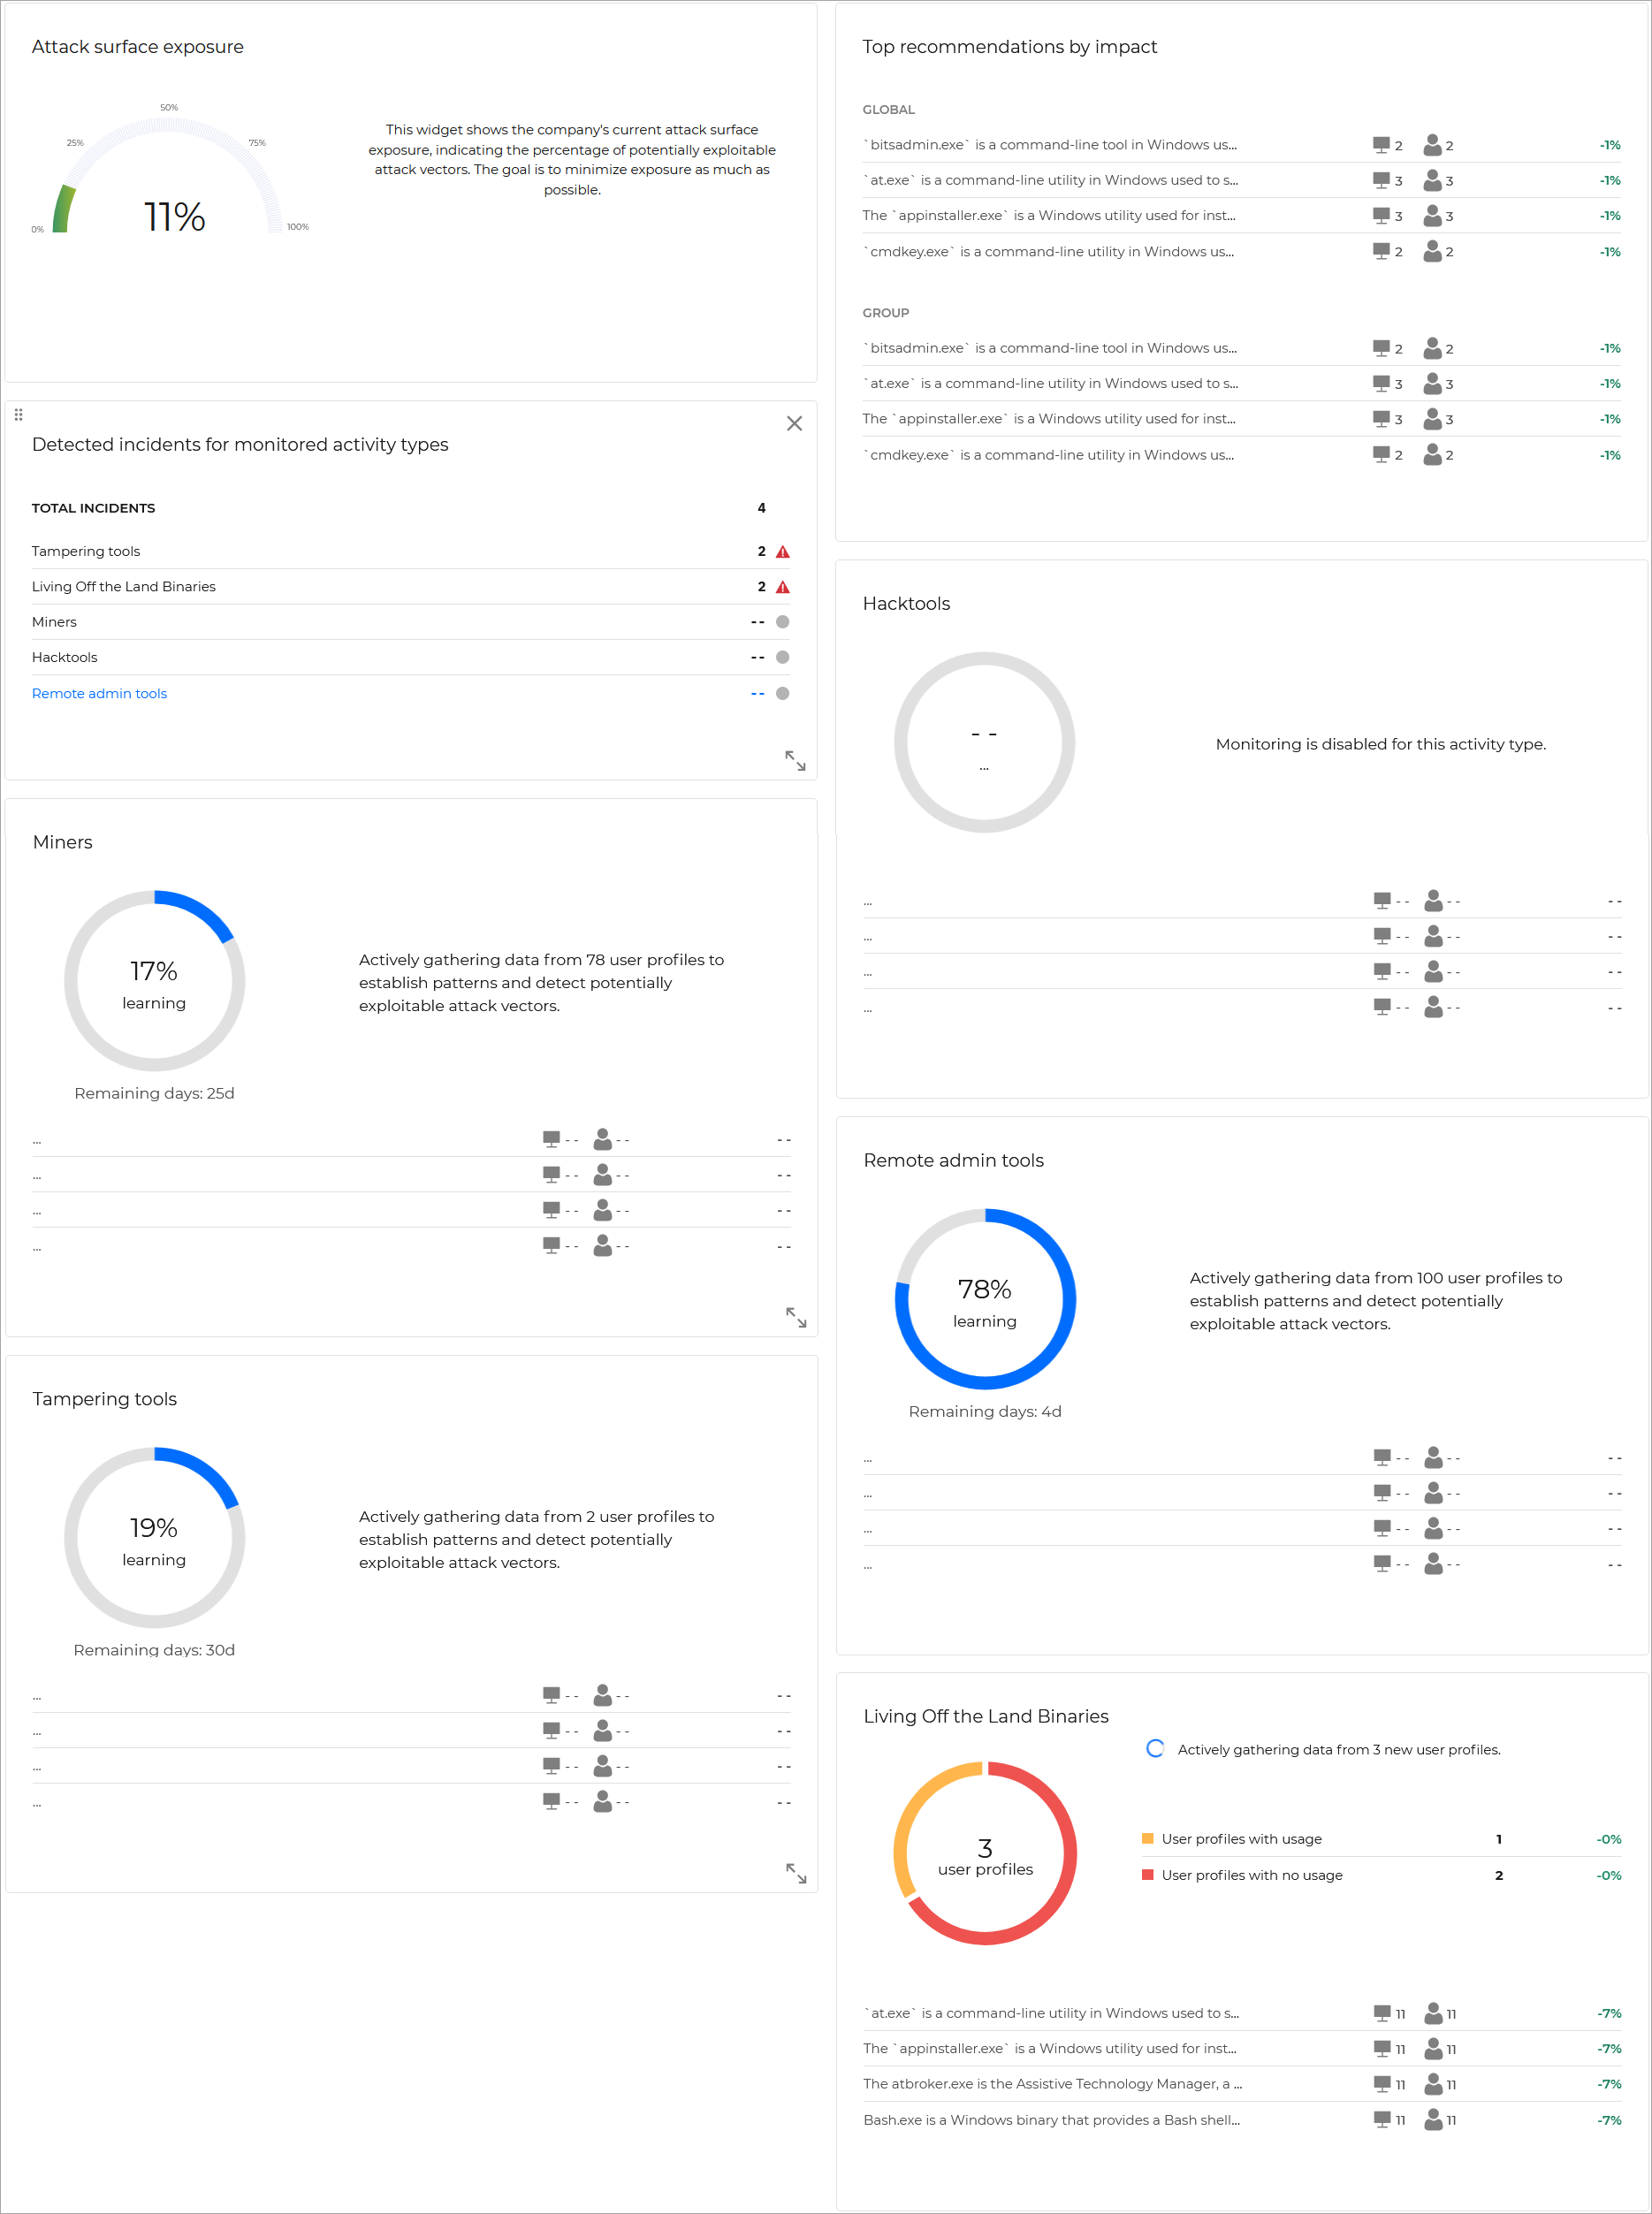
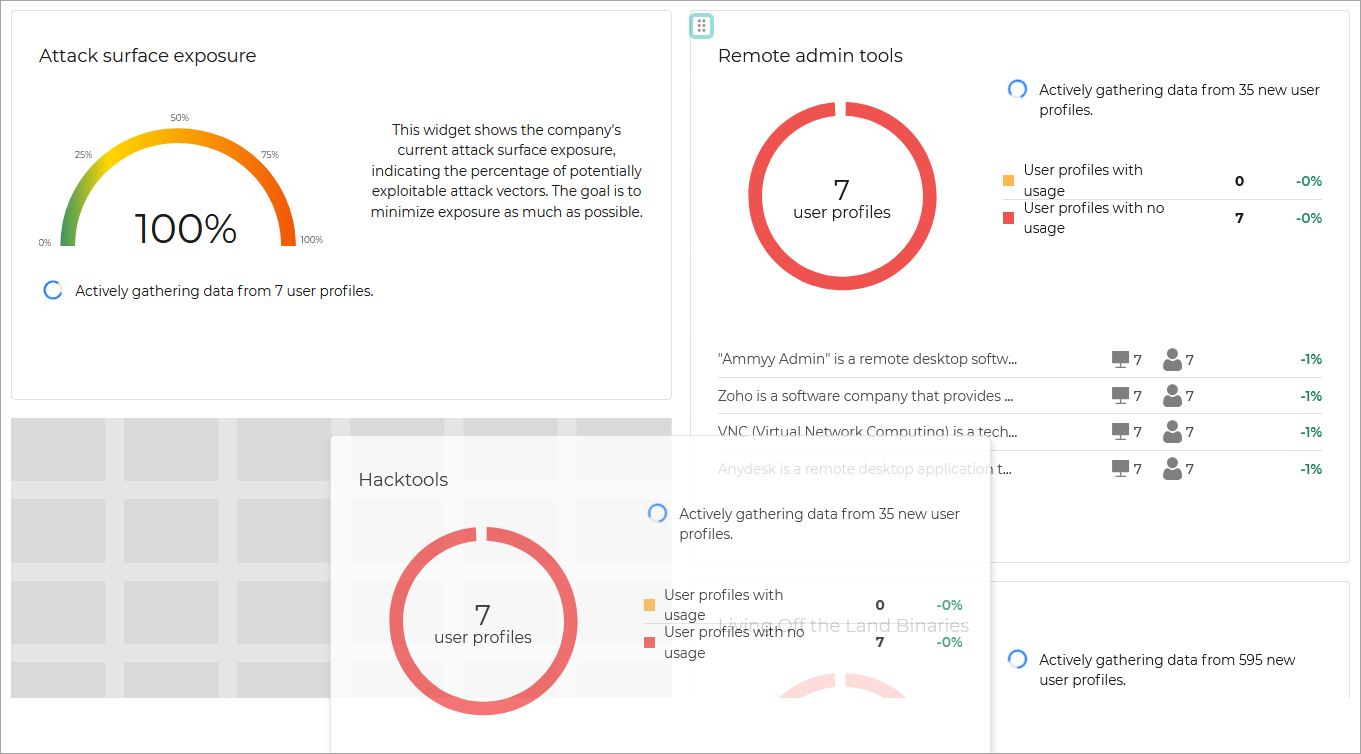
Attack surface exposure
This widget displays the percentage of the company's current attack surface exposure. It highlights the portion of potentially exploitable attack vectors, providing a clear measure of exposure risk. The objective is to reduce this percentage, thereby minimizing the company's vulnerability to potential threats.
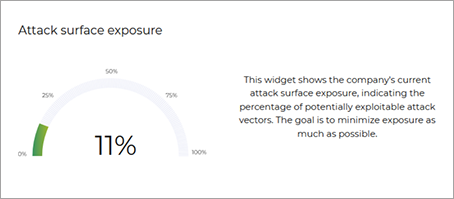
Top recommendations by impact
Note
This section only displays recommendations for data types that have been configured as Direct control in the company's policy. Autopilot recommendations are automatically applied and not displayed in the dashboard and information from data types that have been configured as Autopilot is not displayed in the widgets.
This widget displays prioritized recommendations, categorized into two sections:
High impact - Recommendations that apply on all the behavioral profiles from the company
Medium impact - Recommendations that apply only to specific behavioral profiles from the company.
The recommendations are ranked by their potential impact on reducing attack surface exposure. Each recommendation shows the number of affected behavioral profiles, and it's impact on the overall attack surface exposure, helping to focus efforts where they will be most effective.
Clicking on the icon under the middle column displays the Behavioral Profiles side panel, where a full list of users and endpoints is displayed.
Hovering over a recommendation name reveals the full description, providing further details for informed decision-making.
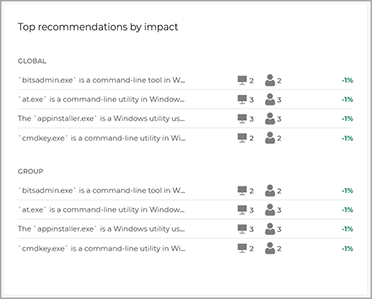
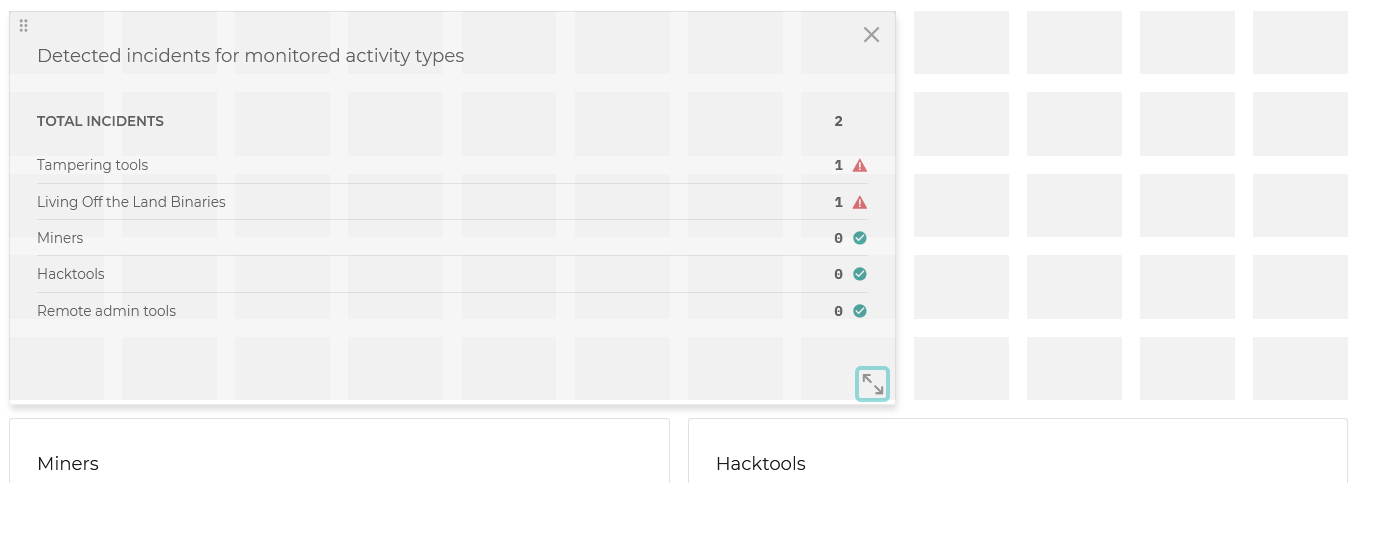
Detected incidents for monitored attack vectors categories
This widget lists the total number of detected incidents associated with each activity type monitored by PHASR:
Tampering tools
Living Off the Land Binaries
CryptoMiners
Piracy tools
Remote admin tools
Each category indicates if monitored processes were involved in incidents. For a detailed list of related incidents, you can follow the links provided in each category. These links direct you to the Incidents page. Each activity type can have one of the following values:
No processes from this category involved in incidents
Processes from this category involved in incidents
Data gathering in progress
No data available
When you pivot to the Incidents page, the Target activity type column is not displayed by default. To view them, open the Settings panel and enable the Targeted activity type option.
Piracy tools
This widget categorizes behavioral profiles in two groups, based on piracy tools usage: .
Behavioral profiles using such tools - are the behavioral profiles for which PHASR has detected usage of tools from that category.
Behavioral profiles not using such tools - are the behavioral profiles for which PHASR did not detect any usage of tools from that category.
For each recommendation related to piracy tools usage, the widget displays the number of affected users and endpoints where the specified action is applicable.
Additionally, it highlights the anticipated impact of each recommendation on the overall risk surface, aiding in more precise risk management and effective mitigation strategies.
Tip
Piracy tools are utilities that can be used to access, manipulate, or exploit systems and data. The PHASR widget for piracy tools monitors user profiles for such tools, identifying users with recorded usage and offering recommendations to minimize risks associated with unauthorized access or misuse.

This widget displays data based on the phase of the data gathering process PHASR is currently in:
Data gathering phase - When PHASR is first enabled, it will start actively gathering data from user profiles to establish patterns and detect potentially exploitable attack vectors. During this time, this widget displays a pie chart to illustrate phase progress.
Monitoring phase - When data has been gathered for all users, the widget shows a final pie chart summarizing the total number of users with piracy tools usage versus those without, providing a comprehensive view of piracy tools exposure across the organization, along with a list of recommendations that have still not been implemented.
Hybrid phase - If during the monitoring phase new users are detected, monitoring will start for those users, while keeping data from existing users.
Previous recommendations remain visible, while the progress of analyzing new user data is displayed on the pie chart. This allows you to view actionable insights while the widget continues to learn about new users.
After gathering data for the new users, the widget will return to monitoring phase.
Hovering over a recommendation name reveals the full description, providing further details for informed decision-making.
Clicking on the icon under the middle column displays the Behavioral Profiles side panel, where a full list of users and endpoints is displayed.
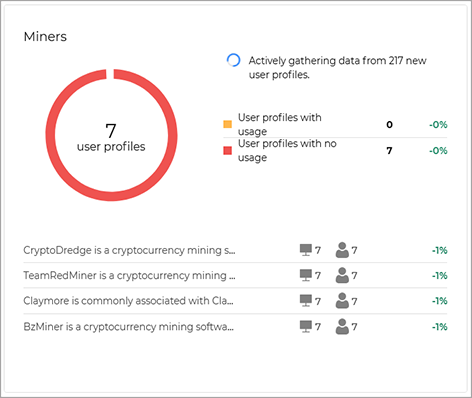
CryptoMiners
This widget monitors behavioral profiles and organizes them based on the detection of cryptocurrency mining tools or activities within the organization’s environment. It provides insights into behavioral profiles with recorded mining activity, and behavioral profiles with no recorded activity, and recommendations for reducing exposure to unauthorized or potentially harmful mining operations.
Tip
CryptoMiners are software tools used for cryptocurrency mining, often consuming significant system resources and posing potential security risks if unauthorized. The PHASR widget for CryproMiners identifies user profiles engaged in mining activities, helping organizations monitor resource usage and reduce exposure through tailored recommendations.
This widget displays data based on the phase of the data gathering process PHASR is currently in:
Data gathering phase – When PHASR is first enabled, the widget begins actively collecting data from user profiles to establish patterns and detect any mining-related activities that could exploit system resources. During this time, this widget displays a pie chart to illustrate phase progress.
Monitoring phase – When data has been gathered for all users, the widget displays a final pie chart summarizing the total number of users with mining activity versus those without. This phase also includes a list of recommendations that have not been yet implemented, providing a comprehensive view of mining exposure across the organization.
Hybrid phase – If during the monitoring phase new users are detected, monitoring will start for those users, while keeping data from existing users.
Previous recommendations remain visible, while the pie chart updates to show the progress of analyzing these new user profiles. This hybrid phase allows actionable insights from existing data to remain available as PHASR continues monitoring and assessing any new mining-related activity.
After gathering data for the new users, the widget will return to monitoring phase.
Hovering over a recommendation name reveals the full description, providing further details for informed decision-making.
Clicking on the icon under the middle column displays the Behavioral Profiles side panel, where a full list of users and endpoints is displayed.
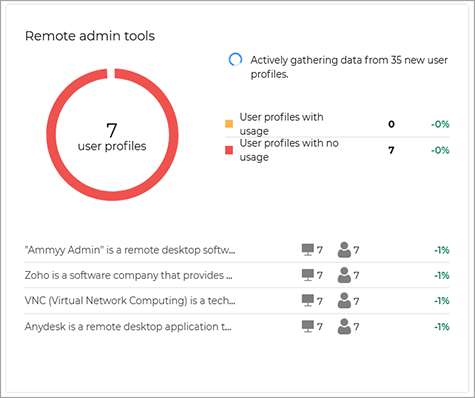
Remote admin tools
This widget monitors behavioral profiles and categorizes them based on the detection of remote administration tools (RATs) within the organization. It provides insights into behavioral profiles with recorded usage of remote admin tools, behavioral profiles with no recorded usage, and recommendations to manage or mitigate any potential risks associated with these tools.
Tip
Remote administration tools (RATs) provide remote access to systems for management or support, but can be exploited if misused. The PHASR widget monitors for RAT usage across user profiles, distinguishing between authorized and potentially risky activities, and provides actionable insights to secure remote access points.
This widget displays data based on the phase of the data gathering process PHASR is currently in:
Data gathering phase – When PHASR is first enabled, the widget begins actively collecting data from user profiles to establish patterns and detect any remote admin tool usage that could pose a security risk if misused. During this time, this widget displays a pie chart to illustrate phase progress.
Monitoring phase – When data has been gathered for all users, the widget displays a final pie chart summarizing the total number of users with remote admin tool usage versus those without. This state also includes a list of recommendations that have not been implemented yet, providing a comprehensive view of remote admin tool exposure across the organization.
Hybrid phase – If during the monitoring phase new users are detected, monitoring will start for those users, while keeping data from existing users.
Previous recommendations remain visible, while the pie chart updates to show the progress of analyzing these new user profiles. This hybrid state allows actionable insights from existing data to remain available as PHASR continues monitoring and assessing any new remote admin tool activity.
After gathering data for the new users, the widget will return to monitoring phase.
Hovering over a recommendation name reveals the full description, providing further details for informed decision-making.
Clicking on the icon under the middle column displays the Behavioral Profiles side panel, where a full list of users and endpoints is displayed.
Tampering tools
This widget monitors behavioral profiles and categorizes them based on the detection of tampering tools within the organization. It provides insights into behavioral profiles with recorded usage of tampering tools, behavioral profiles with no recorded usage, and recommendations to mitigate risks associated with these tools and maintain system integrity.
Tip
Tampering tools are used to alter or bypass system protections, which can compromise security and data integrity. The PHASR widget for tampering tools detects such activities within user profiles, highlighting potential threats and providing recommendations to maintain system integrity.

This widget displays data based on the phase of the data gathering process PHASR is currently in:
Data gathering phase – When PHASR is first enabled, the widget begins actively collecting data from user profiles to establish patterns and detect any tampering tool usage that could compromise system security or integrity. During this time, this widget displays a pie chart to illustrate phase progress.
Monitoring phase – When data has been gathered for all users, the widget displays a final pie chart summarizing the total number of users with tampering tool usage versus those without. This phase also includes a list of any outstanding recommendations that have not been implemented yet, providing a comprehensive view of tampering tool exposure across the organization.
Hybrid phase – If during the monitoring phase new users are detected, monitoring will start for those users, while keeping data from existing users.
Previous recommendations remain visible, while the pie chart updates to show the progress of analyzing these new user profiles. This hybrid phase allows actionable insights from existing data to remain available as PHASR continues monitoring and assessing any new tampering tool activity.
After gathering data for the new users, the widget will return to monitoring phase.
Hovering over a recommendation name reveals the full description, providing further details for informed decision-making.
Clicking on the icon under the middle column displays the Behavioral Profiles side panel, where a full list of users and endpoints is displayed.
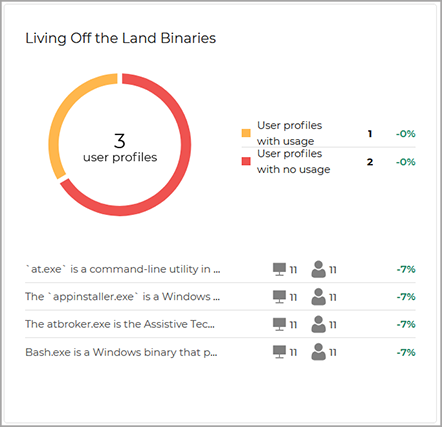
Living Off the Land Binaries
This widget monitors behavioral profiles and categorize them based on the detection of Living Off the Land Binaries (LOLBins) within the organization. It provides insights into behavioral profiles with recorded usage of these binaries, behavioral profiles with no recorded usage, and recommendations to minimize risks associated with the use of system-native tools that can be exploited for malicious purposes.
Tip
LOLBins are legitimate system binaries that can be repurposed for malicious actions, allowing attackers to evade detection. The PHASR widget monitors for LOLBins usage across user profiles, identifying instances where these binaries might be exploited, and offering strategies to reduce risk while maintaining necessary system functionality.
This widget displays data based on the phase of the data gathering process PHASR is currently in:
Data gathering phase – When PHASR is first enabled, the widget begins actively collecting data from user profiles to establish patterns and detect any usage of LOLBins that could be exploited for unauthorized actions. During this time, this widget displays a pie chart to illustrate phase progress.
Monitoring phase – When data has been gathered for all users, the widget displays a final pie chart summarizing the total number of users with LOLBins usage versus those without. This phase also includes a list of any outstanding recommendations that have not been implemented yet, providing a comprehensive view of LOLBins exposure across the organization.
Hybrid phase – If during the monitoring phase new users are detected, monitoring will start for those users, while keeping data from existing users.
Previous recommendations remain visible, while the pie chart updates to show the progress of analyzing these new user profiles. This hybrid phase allows actionable insights from existing data to remain available as PHASR continues monitoring and assessing any new LOLBins activity.
After gathering data for the new users, the widget will return to monitoring phase.
Hovering over a recommendation name reveals the full description, providing further details for informed decision-making.
Clicking on the icon under the middle column displays the Behavioral Profiles side panel, where a full list of users and endpoints is displayed.
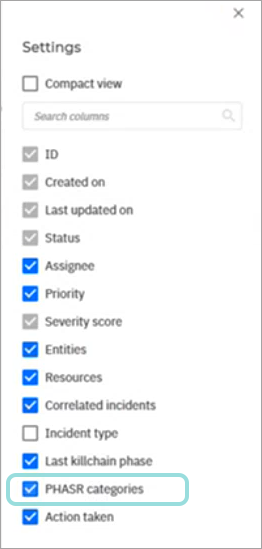
Customizing the dashboard
The ASM Dashboard is fully customizable, allowing you to move and resize widgets, and choose the widgets to be displayed.
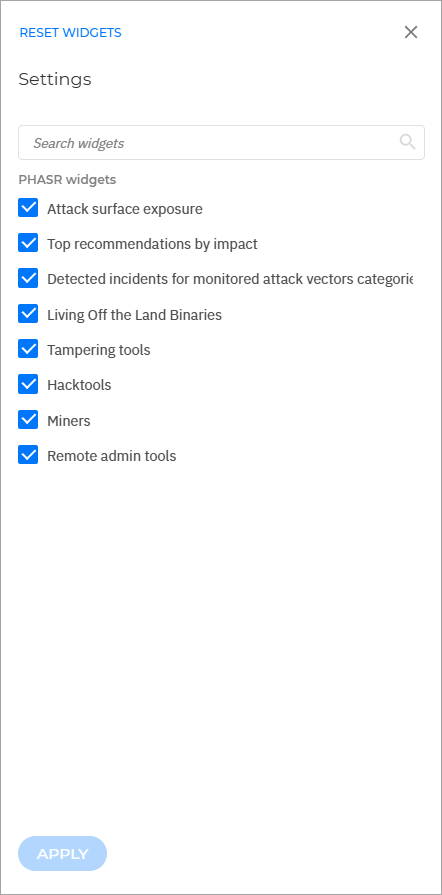
Selecting what widgets are visible
To display or hide a specific widget, click the Settings button on the upper right side of the Dashboard page, select the checkbox for the widgets you want to display, and click Apply.
Moving widgets
To move any widget, using the drag handle button on the upper right side of the widget, drag the widget and drop it where you want it moved.
Resizing widgets
To resize a widget, click the resize button on the lower right side of the widget, and drag it until it reaches the size you want.
Working with smart views
This feature allows you to customize, save, and switch between different loadouts of the page.
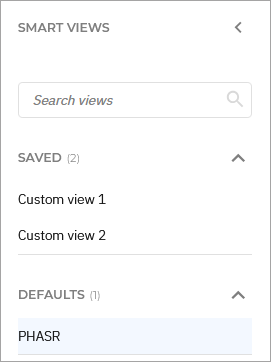
The panel has the following sections:
Search views - Use this search field to filter out the existing views, by name.
Saved - This section displays a list of all your saved views that have not been marked as favorites.
Favorites - All views marked as favorites are displayed under this section.
Defaults - This section displays the views that are available by default.