Managing monitored rules
You can access a list of all the rules currently active that have been applied through PHASR by accessing the PHASR monitored rules page.

The View options menu. This section provides you with multiple functions for working with views:
Reset view - Revert the saved view to its original state.
Show or hide filters - Hide or display the filters menu.
Open settings - Display the Settings panel.
You can use this panel to customize what columns are displayed in the view and enable or disable the Compact view.
The Filters section. You can use these options to customize the risks that are displayed in the below grid.
The following filters are currently available:
Filtering option
Details
Company
Use the searchable drop-down menu to filter the list of monitored rules based on the name of the company they belong to.
Only monitored rules belonging to the selected company are displayed. This filter is available only to Partner type companies.
Rule name
Use the searchable drop-down menu to filter the list of monitored rules based on their name.
Only selected monitored rules are displayed.
Rule trigger date
Use the calendar to select two dates.
Only monitored rules triggered between the selected dates are displayed.
Behavioral profile identities
Use the searchable drop-down menu to filter the list of recommendations based on the name of the identity they were made for.
Only recommendations made for the selected identities are displayed.
Behavioral profile resources
Use the searchable drop-down menu to filter the list of recommendations based on the name of the resource they were made for.
Only recommendations made for the selected resources are displayed.
Targeted activity type
Use the drop-down menu to filter the recommendations based on the name of the targeted activity type.
Only recommendations targeting the selected activity types are displayed.
The Monitored rules grid. The grid displays all active PHASR monitored rules.
The information available for each findings is displayed under the following columns:
Rule name - The name of the monitored rule.
Clicking on the name displays the Monitored rule details side panel.
Recommendations - The number of recommendations created based on this rule.
Clicking on the values under this column redirects you to the PHASR recommendations page, where the grid is automatically filtered to display the recommendations created as a result of triggering the rule.
Targeted activity type - The type of activity the rule applies to.
Rule triggers - The number of events that triggered this rule.
Clicking on the name displays the Rule triggers side panel.
Behavioral profiles - The number of behavioral profiles that this recommendation applies to.
Clicking on the icon under the column displays the Behavioral Profiles side panel, where a full list of users and devices is displayed.
Restricted behavioral profiles - The number of behavioral profiles that are restricted access to, based on this rule.
Clicking on the icon under the column displays the Behavioral Profiles side panel, where a full list of users and devices is displayed.
Company - The company the monitored rules belong to.
Note
More details regarding the information in each column are available type in the Filters section.
Actions menu - Clicking on the inline menu button displays a list of actions available for the recommendation:
View/edit access - This option will display the Edit Access window, where you can view and restrict or allow access to behavioral profiles.
Viewing monitored rules details
You can view additional information regarding a monitored rule by opening the Monitored rule details side panel. To open the side panel, click the name of the rule under the Rule name column:
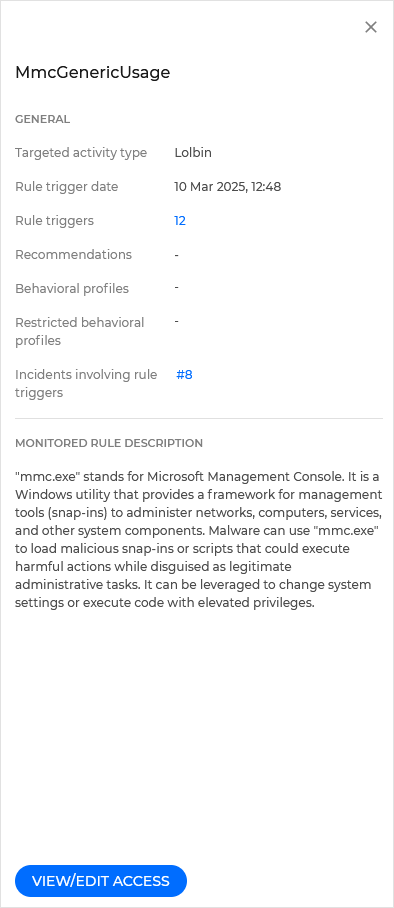
General - this section contains the following information:
Target activity type - The type of activity targeted by the rule.
Rule trigger date - The date and time when the rule was last triggered.
Rule triggers - The number of events that triggered this rule.
Clicking on the name displays the Rule triggers side panel.
Recommendations - The number of recommendations created based on this rule.
Clicking on the values under this column redirects you to the PHASR recommendations page, where the grid is automatically filtered to display the recommendations created as a result of triggering the rule.
Behavioral profiles - The number of behavioral profiles that this recommendation applies to.
Clicking on the icon under the column displays the Behavioral Profiles side panel, where a full list of users and devices is displayed.
Restricted behavioral profiles - The number of behavioral profiles that are restricted access to, based on this rule.
Clicking on the icon under the column displays the Behavioral Profiles side panel, where a full list of users and devices is displayed.
Incidents involving rule triggers - A list of incidents opened as a result of this rule triggering.
Clicking on the associated incident name opens the Graph tab under the Incidents page in a new browser tab.
Monitored rule description - Provide a description on what the rule is and how it applies.
The action button - Depending on the status of the recommendation this button will allow you to Restrict access.
Viewing and editing access
To edit the access to behavioral profiles for a specific rule, follow these steps:
Go to the PHASR monitored rules page.
Locate the rule you want to change access for, and select it's name under the Rule name column.
The Rule details side panel is displayed.
Select Edit access.
The Edit access window is displayed.
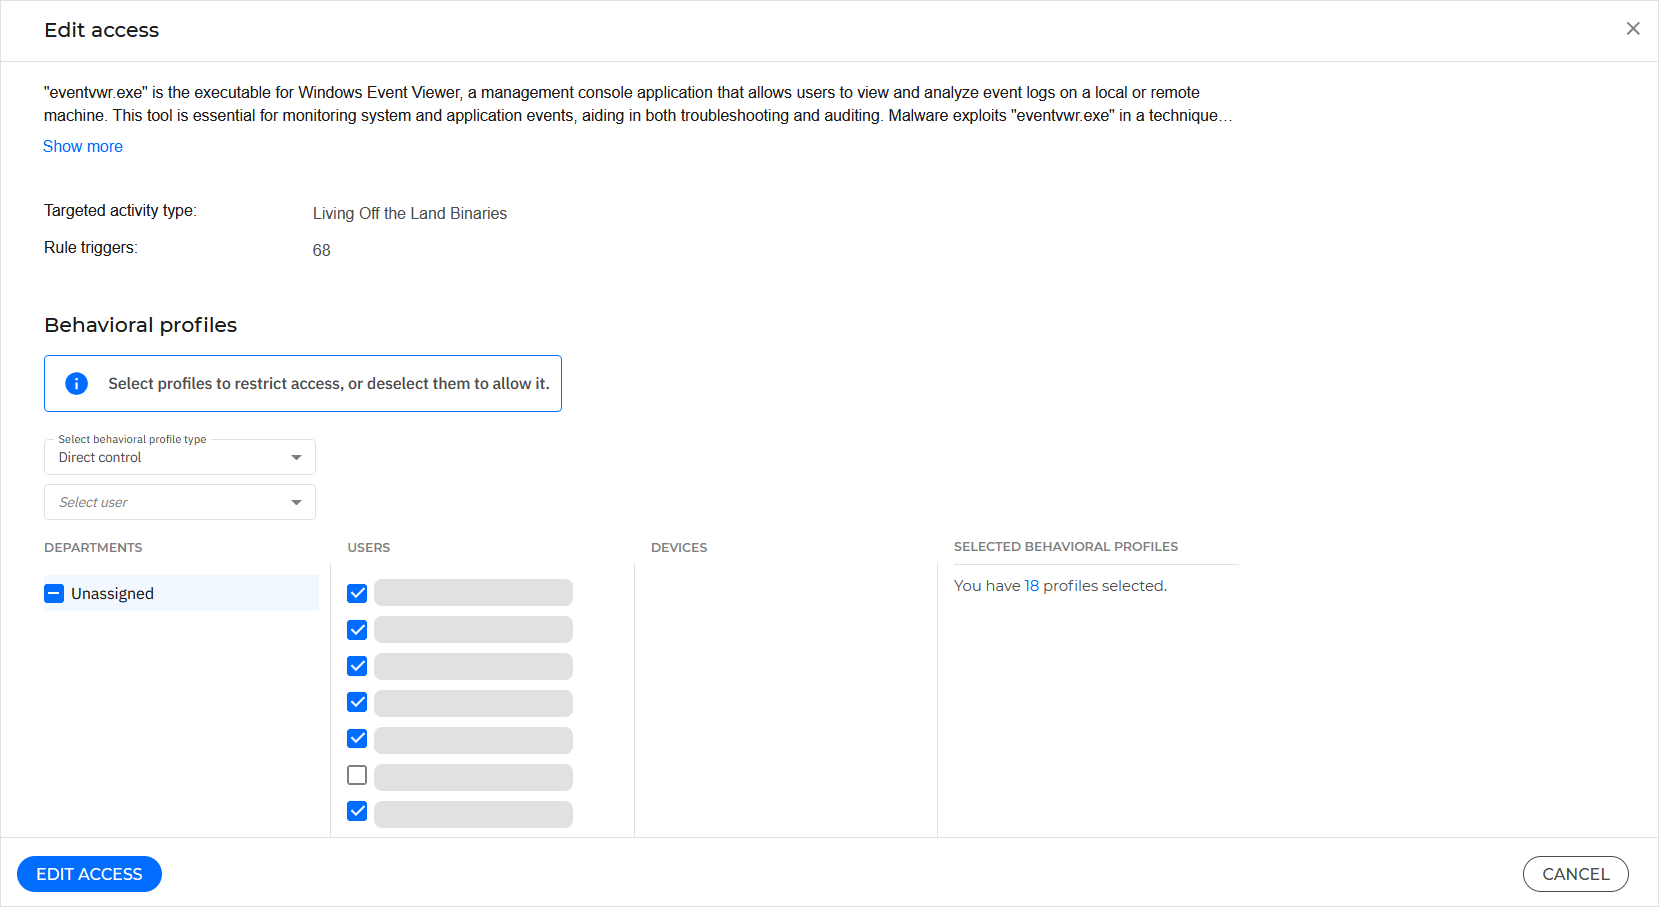
Under the Behavioral profiles section, configure the departments, users, or devices for which you wish to restrict access. Selected profiles will have access restricted.
Select Edit access to apply your changes.
Viewing rule triggers
To view additional details on the events that occurred when a rule was triggered, follow these steps:
Go to the PHASR monitored rules page.
Locate the rule you want to change access for, and select the number displayed under the Rule traiggers column.
TheRule Rule triggers side panel is displayed.
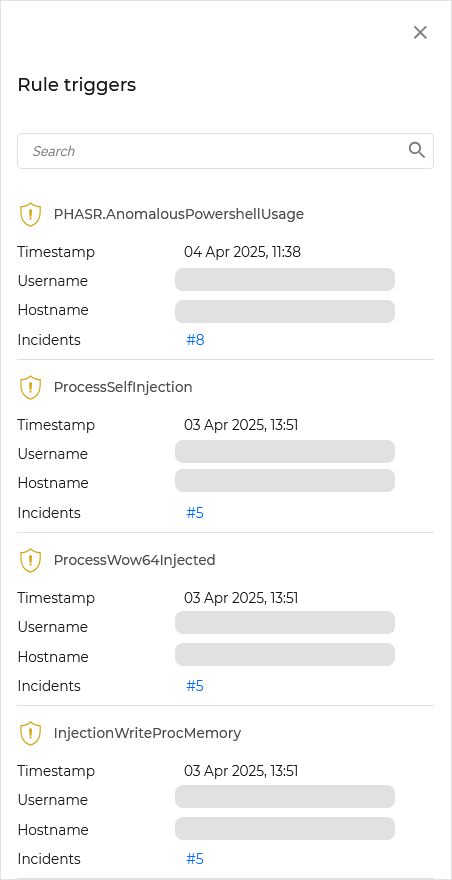
The sidepanel contains information on each event where the rule was triggered:
Timestamp - The time and date when the rule was triggered.
Username - The username that triggered the rule.
Hostname - The host name of the endpoint where the rule was triggered.
Incidents - The incident that was created as a result of triggering the rule.
Clicking on the associated incident name opens the Graph tab under the Incidents page in a new browser tab.