New Network
Overview
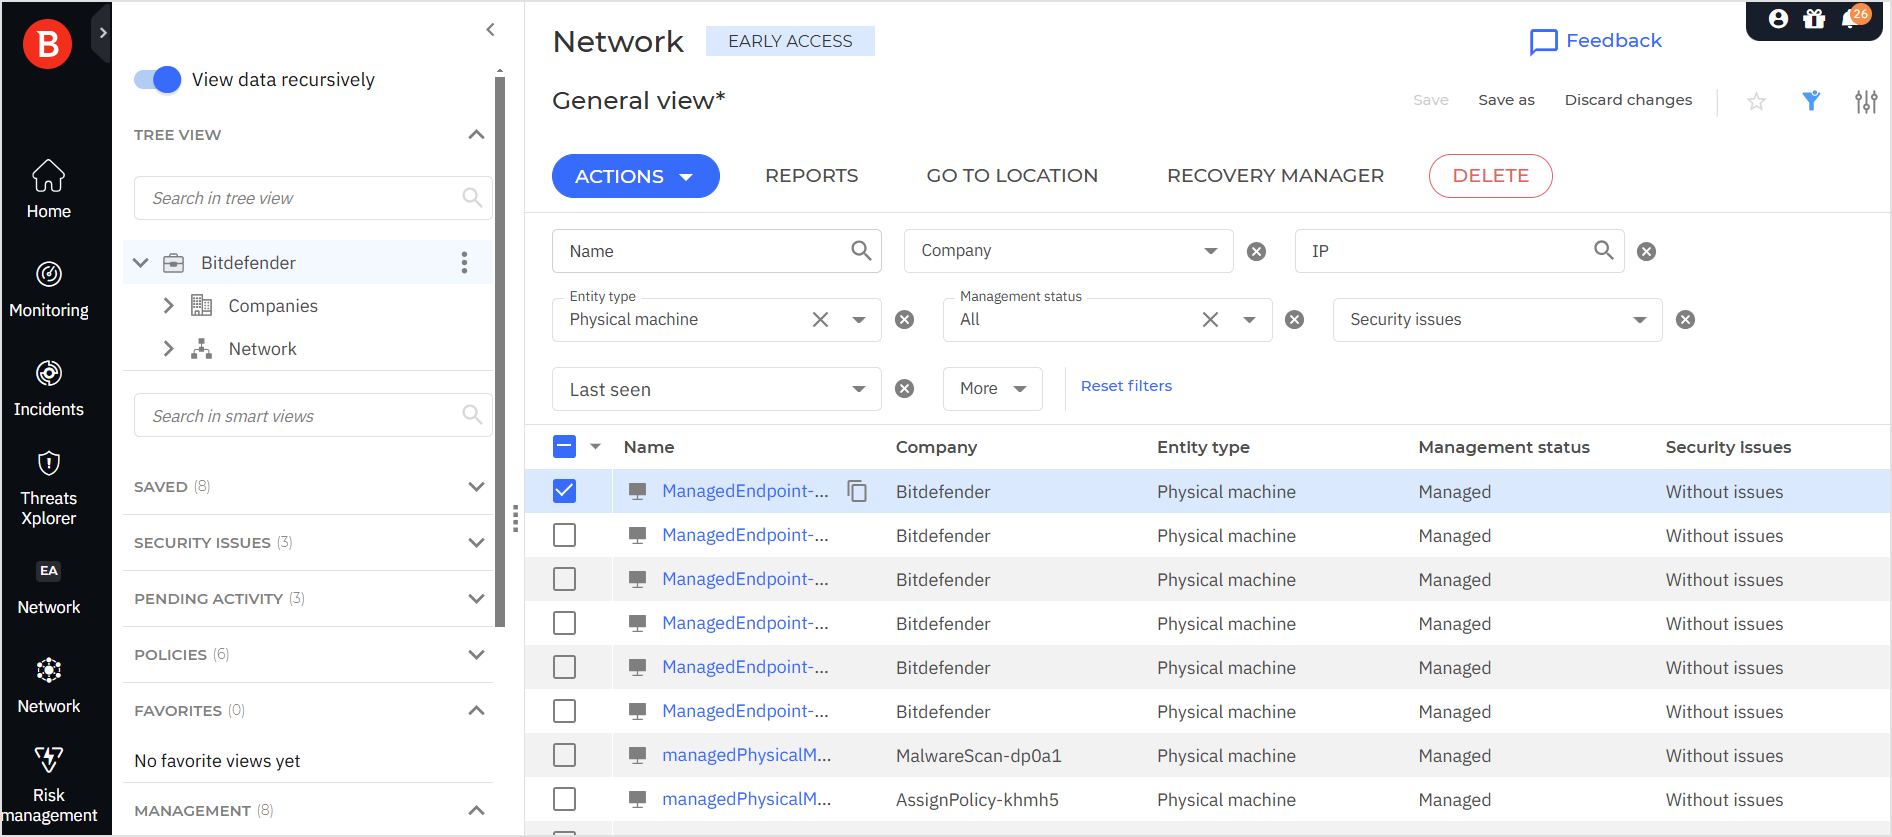
The new Network page provides several brand-new and improved features for exploring and managing all entities available in your network. Entities are defined as physical computers, virtual machines, Security Servers, containers, folders, and companies available in your network.
You can easily view the status of these entities, allocate resources, and troubleshoot issues that may arise. Additionally, the page offers a user-friendly interface for seamless navigation and efficient management of network assets.
Tip
Read the New Network FAQ for more information on the new Network page.
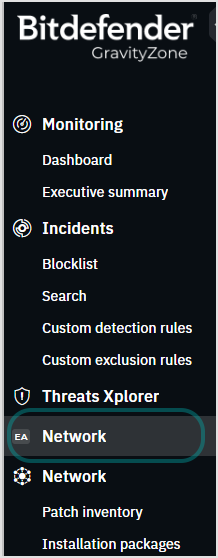
The new page is available in the main GravityZone menu, labeled as EA Network, above the old Network section.
Note
The new Network page does not affect the operation of the old Network, and you can use both at the same time.
The new Network page will completely replace the old Network in GravityZone at the end of April 2025.
Eligibility
To use the feature, you must meet the following requirements:
Your company has a valid license key.
You have administrative privileges over the company's network.
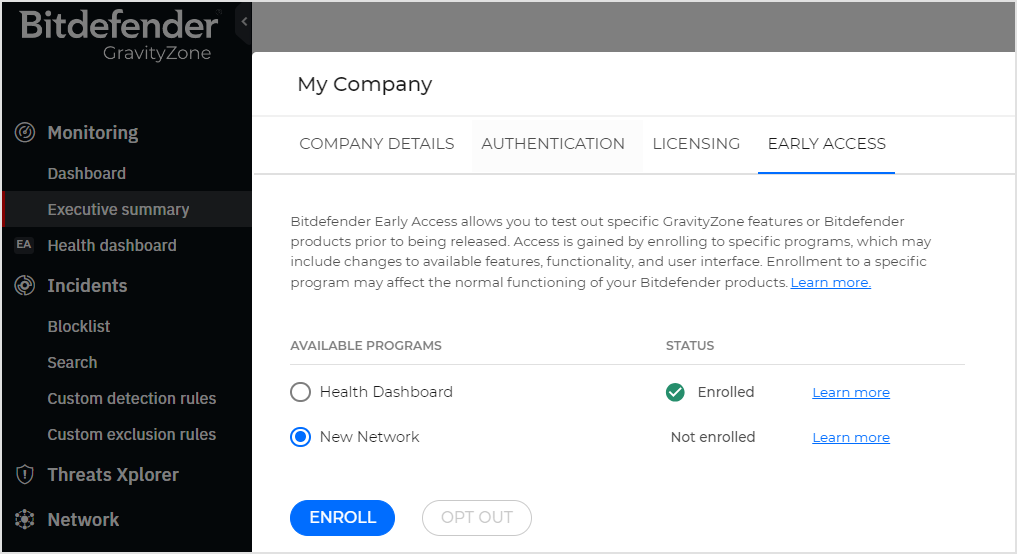
You have access to the My company > Early access tab to select new Network and enroll your company in the program.
Accessing the new Network
To access the new Network section you need to follow these steps:
Log in to GravityZone Control Center.
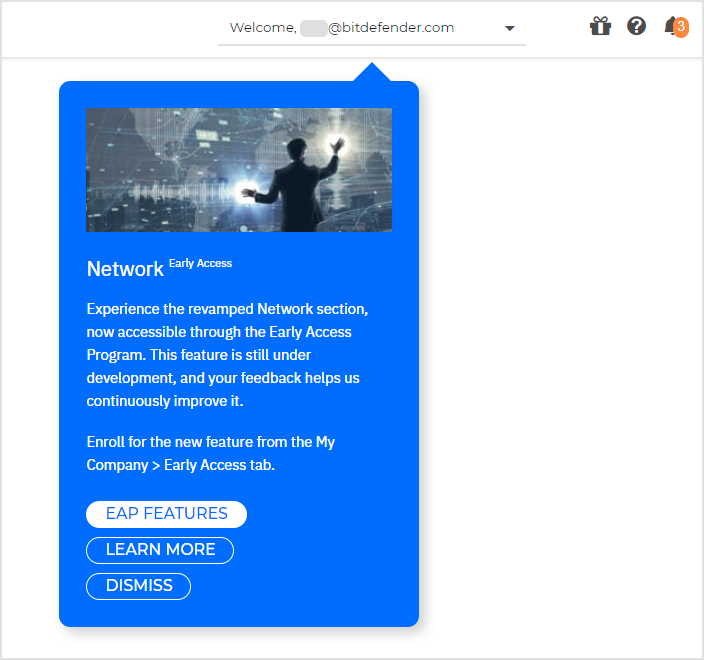
In the blue card that is placed in the upper right corner of your screen, click on EAP FEATURES.
Select New Network.
Refresh the browser page to view the updated GravityZone Control Center.
The new Network page is now available in the main menu, above the old Network section.
To use the new Network page, click on TRY NOW in the blue card.
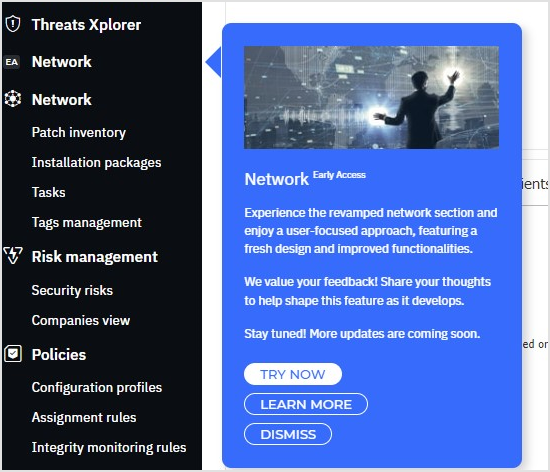
Exploring the new Network
The new Network page contains the following improved areas:
Tree view
The new Network page contains a left-side panel where you have access to the tree view, and allows you to view your data recursively, by using the View data recursively toggle.
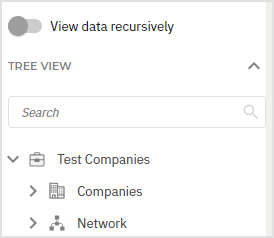
The Tree view features the following elements:
A search box that you can use to search for folders and companies in your network.
A hierarchical structure of your network.
Search in Tree view
The search in Tree view is dynamic, meaning that you can search for an entity only by typing the first characters of its name. You can also use the asterisk (*) as an wildcard, to find names that contain a specific string of characters. For example, use *bc to find a folder named Abcd.
Smart views
Smart views can be found under the Tree view.
Smart views add a new level of customization to your new Network page. You can create your own customized views or use predefined ones and quickly switch between them as needed.
The following categories of smart views are available in the left-side panel.
Saved: includes custom views that you created and saved.
Security issues: shows you the entities with security issues in your network.
Pending activity: shows you the endpoints that require restarting or have a troubleshooting activity in progress.
Policies: shows you the type of policy is applied to endpoints.
Favorites: shows you views that you marked as favorite by clicking the star icon in the grid area.
Management: shows you entities that are managed or unmanaged (whether they have Bitdefender Endpoint Security Tools installed or not).
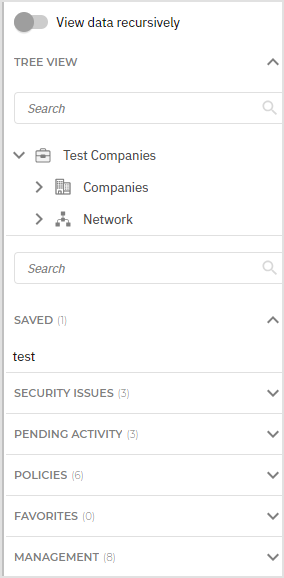
Creating a customized smart view
To create a customized smart view, follow these steps:
In the grid, select the filters you want to apply.
Click Save as at the top left of the page.
Fill in the name of your view.
Save your view.
Your view will be visible on the left side panel, in the Saved category.
Search in Smart views
The search in Smart views is dynamic, meaning that you can search for an item only by typing any string of characters contained in its name. For example, type gen or era to find a smart view named General view.
Search in Smart views does not support wildcards.
Grid
The grid area contains new icons and revised actions, filters, and columns.
Icons
The new Network page features the following icons:
 - Companies
 - Partner type company
  - Customer type company
 - Network
 - Virtual machine, offline
 - Virtual machine, online
 - Physical machine, offline
 - Physical machine, online
 - Container host, offline
 - Container host, online
 - Security container, offline
 - Security container, online
 - Container, offline
 - Container, online
 - Container hosts
 - Security server, offline
 - Security server, online
Note
More icons will be added with future releases.
Actions
The new Network page features in the upper-side a new Actions menu. These actions replace the Tasks menu in the old Network page.
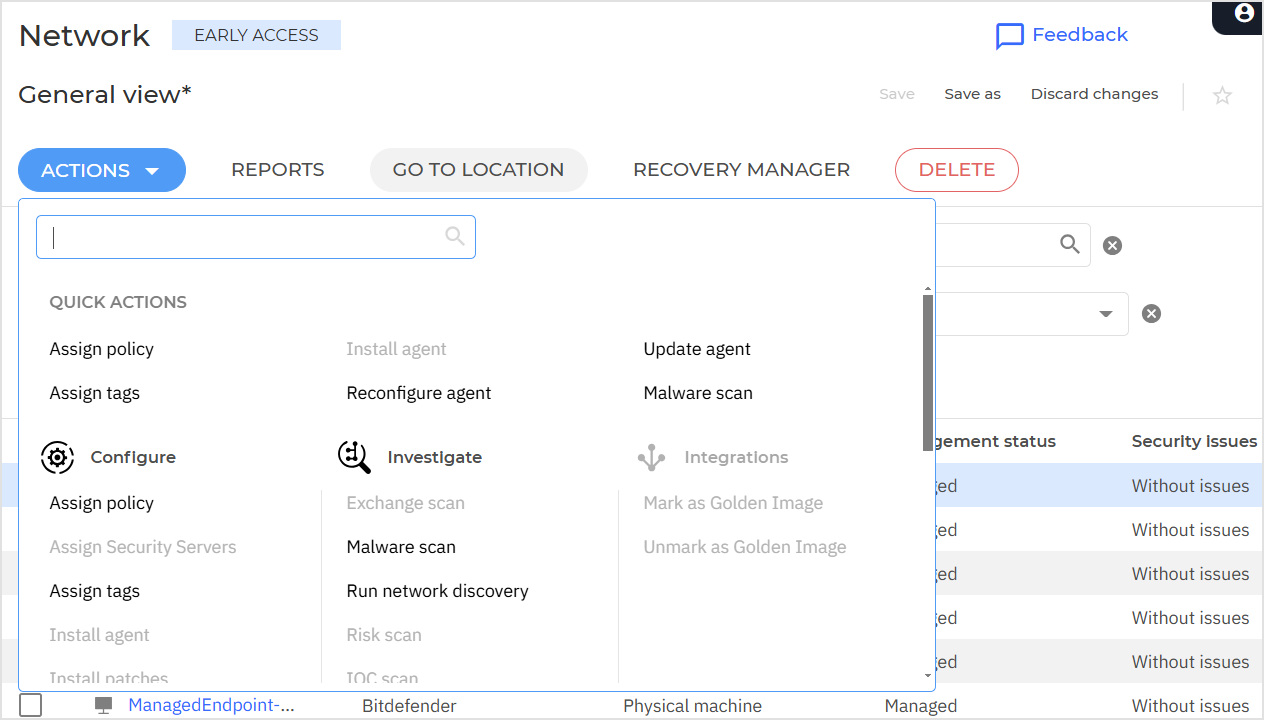
During the initial releases, only some actions come with revised pop-up pages. More action pop-up pages will be updated with future updates.
When taking actions on entities in Network, new tasks are created. You can follow their status on the Tasks page. To learn more about tasks, refer to this Running tasks on computers.
Remote shell
Reports
The new Network section enables centralized reporting for monitoring security policies, assessing network security status, identifying issues, detecting threats, monitoring incidents, and providing easy-to-understand data for upper management. For more details, refer to Reports.
Go to location
In the old Network, the Go to container button selected the collection containing the chosen grid item, reset the filters, and allowed backward navigation if enabled.
In the new Network, this function is renamed Go to location and can be applied to any entity type. It shifts the tree view to the selected collection, retains the current filters, and is only available for single selections. If no item or multiple items are selected in the grid, the action is disabled.
Delete
The delete functionality in the new Network page is designed to handle diverse entity types with precise, context-aware prompts, ensuring each item follows a specific process with relevant messaging.
Contextual menu
The contextual menu provides quick access to common actions like:
Create companies
Create groups
Rename entities
Move entities
Delete entities
Assign Security Servers
Other improvements include the ability to copy entity details to the clipboard and navigate through GravityZone while remembering your network location.
Recovery manager
If endpoint users forget their encryption passwords and can no longer access encrypted volumes on their machines, you can assist them by retrieving recovery keys from the Network page.
Filters and columns
The new Network inherits most of the filters and columns as they were in the old section.
Others have been renamed, such as Logged-in users from Users, Active policy from Policy, and Entity type from Type.
Finally, new columns and filters were introduced in the new Network page, as follows:
Management status - indicates if an endpoint is managed or unmanaged.
Entity type - includes entities that are found in your network:
Partner-managed company
Self-managed company
Company folder
Network folder
Physical machine
Virtual machine
Container
Golden image
Security issues -indicates if an endpoint has security issues, or if it is isolated from the network.
Pending activity -provides information on endpoints that require restarting or have a troubleshooting activity in progress.
Role - indicates network entities with different endpoint roles.
Endpoint: a physical or virtual machine that has Bitdefender Endpoint Security Tools installed with no additional roles.
Exchange Protection: a physical or virtual machine that has Bitdefender Endpoint Security Tools installed with the Exchange role.
Relay: a physical or virtual machine that has Bitdefender Endpoint Security Tools installed with the Relay role.
Security Server: Security Server instance acting as a scan server.
Container host: a container that hosts Linux workloads.
Patch Caching Server: a physical or virtual machine that has Bitdefender Endpoint Security Tools installed, with Patch Caching Server role.
Policy type: indicates if a policy is directly applied, inherited or edited by Power User.
Policy status: indicates if a policy is either active, applied or pending.
To add or remove columns, click the  Settings button in the upper right-side corner of the grid.
To add or remove filters, click the More option at the upper side of the grid.
Submitting feedback
To let us know your thoughts, you can use the Feedback button available in the in the new Network page in the GravityZone console.
